In today’s post, we will be building an Internet of Things (IoT) solar panel remote monitoring system using an Arduino board, a voltage sensor, and the Blynk IoT dashboard. By the end of this tutorial, we will have successfully measured the voltage output of a PV (solar) panel and then sent that data in real time to a remote dashboard on the Blynk server, where it can be accessed from anywhere around the globe.
Solar Panel Remote Monitoring System: Materials Needed
Arduino Uno
Voltage Sensor
Solar panel 21.5V VoC, 20W
ESP8266-01
ESP8266 -12E
All these components can be bought on our online store. Alternatively, all the previous written tutorials on voltage measurements of PV are already detailed here. Read up more on this link. Let us proceed to how to hook this up to an Arduino Uno board, connect the ESP8266-01 WiFi module to it and send the data to cloud server of Blynk.
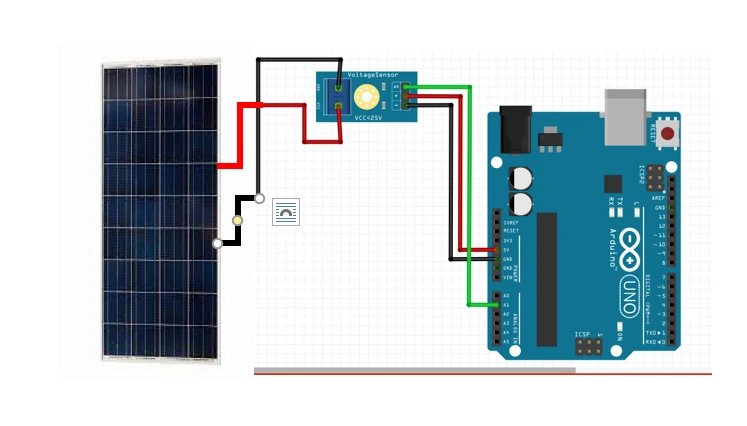
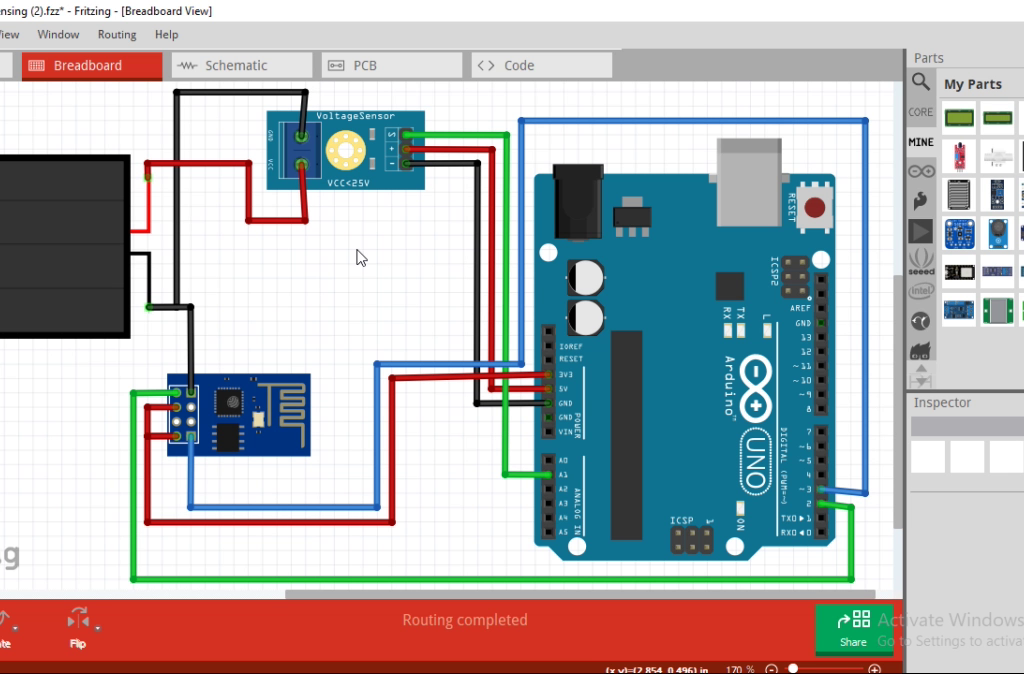
The Circuit Diagram of Solar Panel Remote Monitoring System
The ESP8266-01 (ESP-01) module is a small inexpensive WiFi module that is capable of host Access Point (A.P) and connecting to a server (STA mode). We connected this according to the diagram above. More details of the pin out diagram is shown below.
IoT Based Solar Panel Monitoring using Arduino Voltage Sensor Module
The ESP-01 uses 3.3V logic level. But it also required more current that the normal Arduino 3.3V port can provide. We however tried this and it worked but sometimes when there are other loads it may disturb it. It is usually wise to give it a stable 3.3V from an external power supply.
Explanation of circuit diagram
The circuit diagram for 3.3V, 5V, 9V, 12V and 24V uses the same source code (Arduino Sketch) given below. The battery level can be increased from 3.3V to 24V. and connected as shown above. Once this was done, connect the Arduino uno board to the Personal Computer (PC), power up the Arduino IDE and copy the sketch given below.
Setting Up the Blynk IoT Dashboard
After signing up and signing into your Blynk account, create a new device and pick a name for your project. In our example here, we picked the name IoT Solar Panel Monitoring. Once we are done with the device name creation, we proceed to to adding the widget to holding the IoT remote monitoring.
IoT Based Solar Panel Monitoring using Arduino Voltage Sensor Module: The Blynk Dashboard
We used the gauge and chart widgets for this. The guage name was changed to Voltage Guage, this helped us to quickly identify it was displaying the voltage measured by the voltage sensor module. Ensure when configuring the widgets you select the proper virtual pin and data type you are expecting to be displayed by the widget. See the YouTube video for more explanation. When the web dashboard is all done and ready. You can add your device to your template.
Remember to copy your template ID, template name and Authentication token from the template dashboard because this will be need in the Arduino sketch that will be coded below.
Solar Panel Remote Monitoring System: The Source Code (Arduino Sketch)
// Template ID, Device Name and Auth Token are provided by the Blynk.Cloud
// See the Device Info tab, or Template settings
#define BLYNK_TEMPLATE_ID "XXXXXXXXXXXXXXXX"
#define BLYNK_TEMPLATE_NAME "XXXXXXXXXXXXXXXXX"
#define BLYNK_AUTH_TOKEN "XXXXXXXXXXXXXXXXXXX"
// Comment this out to disable prints and save space
#define BLYNK_PRINT Serial
float PVr1 = 30000.0;
float PVr2 = 7500.0;
float batteryVoltSensor, vinBattery;
const int voltagePinBattery = A1;
#include <ESP8266_Lib.h>
#include <BlynkSimpleShieldEsp8266.h>
char auth[] = BLYNK_AUTH_TOKEN;
// Your WiFi credentials.
// Set password to "" for open networks.
char ssid[] = "Galaxy A51 917E";
char pass[] = "ancsucre21";
// Hardware Serial on Mega, Leonardo, Micro...
//#define EspSerial Serial1
// or Software Serial on Uno, Nano...
#include <SoftwareSerial.h>
SoftwareSerial EspSerial(2, 3); // RX, TX
// Your ESP8266 baud rate:
#define ESP8266_BAUD 115200 //9600 //115200
ESP8266 wifi(&EspSerial);
BlynkTimer timer;
// This function sends Arduino's up time every second to Virtual Pin (5).
// In the app, Widget's reading frequency should be set to PUSH. This means
// that you define how often to send data to Blynk App.
void myTimerEvent(){
//now doing calculations
batteryVoltSensor = analogRead(voltagePinBattery);
batteryVoltSensor = (batteryVoltSensor * 5.0)/1023.0;
vinBattery = batteryVoltSensor/(PVr2/(PVr1+PVr2));
int sensor = analogRead(A2);
int sensor2 = analogRead(A1);
Blynk.virtualWrite(V0, vinBattery);
//Blynk.virtualWrite(V1, sensor);
Blynk.virtualWrite(V1, sensor2);
Serial.print("DC Measured Voltage : ");
Serial.print(vinBattery);
Serial.print(" Sensor Reading : ");
Serial.print(sensor2);
Serial.print(" millis count:");
Serial.println(millis() / 1000);
delay(1000);
}
void setup()
{
// Debug console
Serial.begin(115200);
// Set ESP8266 baud rate
EspSerial.begin(ESP8266_BAUD);
delay(10);
Blynk.begin(auth, wifi, ssid, pass);
// You can also specify server:
//Blynk.begin(auth, wifi, ssid, pass, "blynk.cloud", 80);
//Blynk.begin(auth, wifi, ssid, pass, IPAddress(192,168,1,100), 8080);
// Setup a function to be called every second
timer.setInterval(1000L, myTimerEvent);
}
void loop(){
Blynk.run();
timer.run(); // Initiates BlynkTimer
}
Arduino Source Code Explanation
The Arduino sketch written above using the ESP8266-01 library. The choice of the ESP-01 is because of its inexpensive nature and it is also portable and can be use small space when coupling inside a case. However, using this WiFi module as a peripheral has some limitations, particularly for the Arduino Uno board. It is tricky and most times, the Software Serial mode doesn’t work. And yet, we pulled it off. We connected the ESP-01 in Software Serial mode to the Arduino Uno board. Specifically, the pin 2 and 3 respectively.
The Voltage sensor module is made up of two resistors connected in series configuration. These two resistors are 30,000 Ohms and 7500 Ohms values respectively. This is specified in the program above and we used a variable to hold some constants we would need later. The WiFi credentials are also included in the sketch. The rest of the program code is using a custom function to run the voltage monitoring and sending the readings got to the Blynk cloud. This is placed on a timer, of every one second.
Results
The serial monitor printing show that the ESP-01 is connected to the WiFi network and it has successfulyl made a handshake with the Blynk IoT dashboard. We can measure or take the reading of our DC Voltage reading via the Analog pins on the Arduino, using the Serial Monitor on the Arduino IDE. Depending on the Power supply (which are mostly DC Voltage connected to the Output of the Voltage Sensor).
result printed on the Blynk IoT dashboard
When it is being tested, we can see the measured voltage of the PV panel displayed on the voltage widget as shown above. The PV panel at the moment being indoors was only harvesting 20V DC as measure by the voltage sensor module. And we could see the measured voltage over time on the bar char displayed on the right hand side.
Conclusion
The project tutorial for IoT Based Solar Panel Monitoring using Arduino Voltage Sensor Module has been shown to be successful. We have been able to measure C voltage using the Voltage sensor module and Arduino Uno baord, and using the ESP-01, exported the read voltage data to the Blynk IoT dashboard where we could monitor the setup remotely form anywhere in the world. Let us know if you followed these step mentioned in this blog post to achieved the same value in the comment section below.
A feulless generator is a device that generates electricity without the use of fuel. It is powered by a battery, which is charged by a variety of sources, such as solar power, wind power, or kinetic energy. Feulless generators are often touted as a more environmentally friendly alternative to traditional generators, which emit harmful pollutants into the air.
IoT Solar Based Feulless Generator
In this project, the watch phrase was to design and construct a feulless generator that would be renewable and rechargeable. Since the project was designed where there is optimum sunshine; the solar based renewable energy source we used. To charge a 12V 7Ah rated battery via a 20W rated PV panel; which in turn would power a DC motor that would drive a dynamo (DC generator) that was responsible for powering the DC loads (the DC bulbs). For easy and better experience of the user, the project was designed to be internet of things (IoT) based. This meant it was controlled and monitored remotely from anywhere on the globe.
The Materials/Components Needed For the Project Design
The component displayed above, known as a DC generator, was driven by an electric motor in order to generate electricity. A DC generator was used to model the operation of an Alternator. Ideally, an alternator ought to have been used instead, but it was not used due to its high cost of acquisition, also resulting from its unavailability in the local market. This palm-sized DC generator produces electricity when its armature/rotor copper windings cut through a permanent magnetic field. With the aid of a planetary gear transmission set, the required speed to generate a usable amount of power is easily obtained.
Technical Specifications:
Minimum output voltage: 5V
Maximum output Voltage: 24V.
Maximum output current: 1.5Amps
Maximum load supply power: 20 Watts
The output voltage varies with the speed of the electric motor driving it.
The 90° bend support
Component
Quantity
12V DC motor
1
NodeMCU dev board
1
Charge controller
1
4 channel relay module
1
20W solar panel
1
12VDC Electric Generator (Dynamo)
1
The 90° bend support
2
Veroboard or Get Smartech PCB Project Board
1
1602 LCD module
1
3.7V 2.8Ah LiPo battery
1
LiPo Charging Module
1
Voltage Sensor Module
1
12V 7Ah Rechargeable battery
1
resistors. 1k, 22k, 100k
many
TIP41C NPN Transistor
1
I2C LCD Module
1
Table of components used in this project design
Schematic Diagram for IoT Feulless Generator Project (Control Side)
schematic diagram of the IoT Feulless Gen control (Electronics Control side)
Explanation of Feulless Generator Schematic Diagram
The heart of the project design was the NodeMCU. It was important to use a microcontroller that had internet capability. The NodeMCU has the capacity to use its WiFi client access to connect to an existing hotspot with internet. This would give it access to the Blynk server where the remote controls were placed. The relay modules connected to the NodeMCU was working on a logic voltage of 5V. But the GPIO pin can only output 3.3V. We used a transistor logic level inverter to get the 5V HIGH and 0V. How does one convert from one logic level to the other? We used the method of a transistor switch controlled by 3.3-volt logic to drive 5-volt logic. What constitutes a HIGH and a LOW on the ESP32 boards and the modules they control are not the same. For the ESP8266-12E board, a digital pin, whether input or output, is considered in a LOW state for voltages below 0.55 volts and in a HIGH state for voltages between 2.5 and 3.3volts. Whereas the modules a digital pin, whether input or output, is considered in a LOW state for voltages below 1.5 volts and in a HIGH state for voltages between 3 and 5volts. The schematic below solved the problem.
logic voltage shifter using transistor and resistor
Schematic Diagram for IoT Feulless Generator Project (Mechanical Side)
schematic diagram of the mechanical side of the IoT Solar Based Feulless Generator
This was done by connecting the PV panel to the charge controller PV input power rails. The 30W PV panel was use to charge the 12V battery. The charge controller has an output for load and this is where the DC motor was connected. A mechanical coupler that was cylindrical in shape and it held the shaft of the DC and the DC electrical generator together. This meant that when the DC motor turns, the shaft of the DC electric motor also turned the shaft of the electric generator. This would output a voltage of 12-24V DC at the output of the DC electric generator.
Designing The IoT Dashboard on Blynk
The app was done using Blynk IoT cross platform; as shown above we used the button widget to control the LED. In the LOW (off) state, the LEDs is turned off as shown on the picture on the right hand side. The design worked very well as programmed and the expectations were met. We were also capable to control the two LEDs on the GPIOs with just one button.
Also we added two extra button widgets to control the other bulb while a third widget button was used to control the turning on state of the DC motor. A virtual widget was used to measure the output voltage of the generator.
Programming The Project Design
// Template ID, Device Name and Auth Token are provided by the Blynk.Cloud
// See the Device Info tab, or Template settings
#define BLYNK_TEMPLATE_ID "TMPLA3ZMWUIY"
#define BLYNK_DEVICE_NAME "Feuless Generator Monitoring Project"
#define BLYNK_AUTH_TOKEN "8knfz2FVAOraLJ0OvEqww_vVAdne0m0Y"
// Comment this out to disable prints and save space
#define BLYNK_PRINT Serial
#include <ESP8266WiFi.h>
#include <BlynkSimpleEsp8266.h>
#include <Wire.h>
#include <LiquidCrystal_I2C.h>
char auth[] = BLYNK_AUTH_TOKEN;
//create and instance of the LiquidCrystal, this name will be use as a class to call all the functions of the lcd library
LiquidCrystal_I2C lcd(0x27, 16, 2);
// Your WiFi credentials.
// Set password to "" for open networks.
char ssid[] = "AncII";
char pass[] = "eureka26";
BlynkTimer timer;
int volt;
float voltage;
float divider = 0.936;
float multiFactor = 2.423;
int bulbPin = D3;
int bulbPin2 = D6;
int genStartPin = D5;
// Variables will change:
int ledState = LOW;
// Generally, you should use "unsigned long" for variables that hold time
// The value will quickly become too large for an int to store
unsigned long previousMillis = 0;
// constants won't change:
const long interval = 5000;
void sendSensor(){
volt = analogRead(A0);// read the input
float voltage = (volt *5.273)/1023.999;
voltage = voltage/ divider; // divide by 100 to get the decimal values
voltage *= multiFactor;
int voltage1 = round(voltage);
Serial.print(voltage1);
Serial.println();
// // You can send any value at any time.
// // Please don't send more that 10 values per second.
Blynk.virtualWrite(V3, voltage1);
}
BLYNK_WRITE(V0) {
int genWidget = param.asInt();
Serial.println(genWidget);
if(genWidget == 1){
digitalWrite(genStartPin, HIGH);
Serial.println("Gen ON");
}
else{
digitalWrite(genStartPin, LOW);
Serial.println("Gen OFF");
}
}
BLYNK_WRITE(V1) {
int bulb1Widget = param.asInt();
Serial.println(bulb1Widget);
if(bulb1Widget == 1){
digitalWrite(bulbPin, HIGH);
Serial.println("bulb 1 ON");
}
else{
digitalWrite(bulbPin, LOW);
Serial.println("Bulb 1 OFF");
}
}
BLYNK_WRITE(V2) {
int bulb2Widget = param.asInt();
Serial.println(bulb2Widget);
if(bulb2Widget == 1){
digitalWrite(bulbPin2, HIGH);
Serial.println("bulb 2 ON");
}
else{
digitalWrite(bulbPin2, LOW);
Serial.println("bulb 2 OFF");
}
}
void displayVoltage(){
volt = analogRead(A0);// read the input
float voltage = (volt *5.273)/1023.999;
voltage = voltage/ divider; // divide by 100 to get the decimal values
voltage *= multiFactor;
int voltage1 = round(voltage);
lcd.clear();
lcd.setCursor(1,0);
lcd.print("VOLTAGE OUTPUT");
lcd.setCursor(6, 1);
lcd.print(voltage1);
lcd.print(" V");
}
void displayBulbState(){
lcd.clear();
lcd.setCursor(1,0);
lcd.print("BULB 1 BULB 2");
int bulb1Read = digitalRead(bulbPin);
int bulb2Read = digitalRead(genStartPin);
if(bulb1Read == HIGH){
lcd.setCursor(2, 1);
lcd.print("ON");
}
if(bulb1Read == LOW){
lcd.setCursor(2, 1);
lcd.print("OFF");
}
if(bulb2Read == HIGH){
lcd.setCursor(10, 1);
lcd.print("ON");
}
if(bulb2Read == LOW){
lcd.setCursor(10, 1);
lcd.print("OFF");
}
}
void setup(){
// Debug console
Serial.begin(115200);
pinMode(bulbPin, OUTPUT);
pinMode(bulbPin2, OUTPUT);
pinMode(genStartPin, OUTPUT);
Blynk.begin(auth, ssid, pass);
lcd.init(); // initialize the lcd
Wire.begin(); // Start the I2C
// Turn on the blacklight and print a message.
lcd.backlight();//turn on the lcd backlight
lcd.setCursor(0,0);
lcd.print("WELCOME MR. JEFF");// ouput the text on the lcd screen
delay(3000);
lcd.clear();
lcd.setCursor(0,0);
lcd.print("IoT BASED FEULESS");
lcd.setCursor(3,1);
lcd.print("GENERATOR");
delay(3000);
lcd.clear();
lcd.setCursor(0,0);
lcd.print("Connected to:");
lcd.setCursor(0,1);
lcd.print(ssid);
delay(3000);
lcd.clear();
// Setup a function to be called every second
timer.setInterval(1000L, sendSensor);
}
void changeDisplay(){
unsigned long currentMillis = millis();
if (currentMillis - previousMillis >= interval) {
// save the last time you blinked the LED
previousMillis = currentMillis;
// if the LED is off turn it on and vice-versa:
if (ledState == LOW) {
ledState = HIGH;
displayVoltage();
}
else {
ledState = LOW;
displayBulbState();
}
// set the LED with the ledState of the variable:
Serial.println(ledState);
}
}
void loop(){
Blynk.run();
timer.run();
changeDisplay();
}
Explanation of the Arduino Code
The code began with the setup() function where it began the serial communication protocol at 115200 bits per second. This is the speed at which the microcontroller communicates with the programming laptop. A custom function was created called sendSensor() where an integer variable volt was used to read the analog voltage. Another floating variable voltage was used to calculate the actual voltage. We then printed out this result.
The function BLYNK_WRITE was used to receive commands from the Blynk server this was shown in code line 63, 80 and 96. The functions contained some IF statements such that when the button is pressed and the received integer sent is 1, the NodeMCU would turn on the particular actuator that was assigned to the GPIO pin. However, if the integer sent from the Blynk cloud, this would turn off the actuator that was assigned to the GPIO pin.
Stopping Trip Off Of the Project Design
LiPo battery charging module
When the project was powered from the 12V 7Ah battery alone, the initial current consumption of the 12V DC motor doesn’t leave any voltage for the MCU and the other components to run. To solve this, a LiPO battery and charge controller was used to get the NodeMCU in a ready state just in case the battery was not fully charged and it has to trip of when the DC motor starts running.
This is LiPo battery was charged by the LiPo charging module. It allowed the input of 5V from a type “B” USB power cord found on the side of the charging module. And has an output for powering load that can be regulated up to 18V. This is because the LiPo charging module has an onboard potentiometer that can use to increase or decrease the output voltage. This was perfect for the design and had to be incorporated into the schematic.
Hello, and welcome to another tutorial project. In this session, we will be designing an IoT based greenhouse project. It can monitor the the soil moisture level, the air humidity and the temperature of the greenhouse. It can also automatically control these parameters by pumping more water into the soil through an underground pump network, making the air of the plant more humid using a humidifier, and controlling the temperature through ventilation fans.
The Materials Required for this Project
The table below is the materials required for this project construction. Also we have included the the quantity needed. You can head over to our online shop to get most of the items here.
ITEM DESCRIPTION
QUANTITY
UNIT COST
TOTAL UNIT
LiPo CHARGING MODULE
1
DHT22
1
3×6 INCH PATRESS BOX
1
Connector
3
RESISTORS
2
CONNECTING WIRES
3 yards
Sil Moisture sensor
1
MQ135 SENSOR
1
LIPO BATTERY
1
SOLDER
1
SOLDERING IRON
1
Buzzer
1
NodeMCU Board
1
Acryllic glass
1
Plastic container
1
Plywood board
1
Glue stick
10
DC SWITCH
1
FEMALE HEADERPIN
2
MISCELLANEOUS
table of materials/components needed for the project design
Schematic Diagram for the IoT Based Green House Project
schematic diagram for IoT based green house project
The DC fans are connected in parallel to each other and are energized by an NPN transistor which is fired at the base by an 1k resistor. When the button on the web dashboard is pressed, the received signal indicates the state of the DC fan. Either to baise the base of the transistor or not. The DC pump is also controlled by the transistor since it demands some initial current at start up. The base of the resistor is connected to a 1k resistor that is connected to a GPIO pinon the NodeMCU. When this GPIO pin is high at 3.3V, the base of the transistor is biased, and when it is LOW it is not biased.
The soil moisture level sensor is connected to the only ACD pin on the NodeMCU, this is the A0 pin. The analog output pin (A0) was connected to this A0 on the NodeMCU. And a program was used to read the analog reading of the sensor. Alternatively, you can download the code and schematic diagram from the link here.
Programming the Project (Arduino Sketch)
#define BLYNK_TEMPLATE_ID "xxxxxxxxxxxxxxxx" //replace with your unique ID
#define BLYNK_TEMPLATE_NAME "Green House Project"
#define BLYNK_AUTH_TOKEN "xxxxxxxxxxxxxxxxxxxx" //replace with your token
#include "DHT.h"
// Comment this out to disable prints and save space
#define BLYNK_PRINT Serial
#include <ESP8266WiFi.h>
#include <BlynkSimpleEsp8266.h>
char auth[] = BLYNK_AUTH_TOKEN;
char ssid[] = "Galaxy A51 917E";
char pass[] = "ancsucre21";
#define DHTPIN D3 // Digital pin connected to the DHT sensor
//outline the actuATORS
#define dcFan D6
#define dcPump D8
#define humdifier D5
//state the inputs
#define soilMostureSensor A0
// Uncomment whatever type you're using!
//#define DHTTYPE DHT11 // DHT 11
#define DHTTYPE DHT22 // DHT 22 (AM2302), AM2321
//#define DHTTYPE DHT21 // DHT 21 (AM2301)
DHT dht(DHTPIN, DHTTYPE);
//variables
float h, t, f;
int readSoil, pumpButton, tempButton, humidifierButton;
BLYNK_WRITE(V3) {
pumpButton = param.asInt();
if((readSoil > 19) && (readSoil <= 54)){
if (pumpButton==1){
digitalWrite(dcPump, HIGH);
}
else if(pumpButton==0){
digitalWrite(dcPump, LOW);
}
}
}
BLYNK_WRITE(V4) {
tempButton = param.asInt();
Serial.println(tempButton);
if((t > 19) && (t <= 40)){
if (tempButton==1){
digitalWrite(dcFan, HIGH);
}
else if(tempButton==0){
digitalWrite(dcFan, LOW);
}
}
}
BLYNK_WRITE(V5) {
humidifierButton = param.asInt();
if (humidifierButton==1){
pressHum();
}
else if(tempButton==0){
Serial.println("press again");
}
}
void pressHum(){
digitalWrite(humdifier, LOW);
delay(100);
digitalWrite(humdifier, HIGH);
}
void setup() {
//begin serial comm.
Serial.begin(9600);
//state the actuators as outputs
pinMode(dcPump, OUTPUT);
pinMode(humdifier, OUTPUT);
pinMode(dcFan, OUTPUT);
//turn off humidifier
pressHum();
delay(3000);
pressHum();
delay(3000);
pressHum();
//begin the dht sensor
dht.begin();
Blynk.begin(auth, ssid, pass);
digitalWrite(dcFan, LOW);
}
void turnOffHumidifier(){
pressHum();
delay(3000);
pressHum();
delay(3000);
pressHum();
}
void turnOnHumidifier1(){
pressHum();
}
void turnOnHumidifier2(){
pressHum();
delay(3000);
pressHum();
}
//create a fxn to read the temp and hum
float readTempHum(){
// Reading temperature or humidity takes about 250 milliseconds!
// Sensor readings may also be up to 2 seconds 'old' (its a very slow sensor)
h = dht.readHumidity();
// Read temperature as Celsius (the default)
t = dht.readTemperature();
// Read temperature as Fahrenheit (isFahrenheit = true)
f = dht.readTemperature(true);
// Check if any reads failed and exit early (to try again).
if (isnan(h) || isnan(t) || isnan(f)) {
Serial.println(F("Failed to read from DHT sensor!"));
//return;
}
// Compute heat index in Fahrenheit (the default)
float hif = dht.computeHeatIndex(f, h);
// Compute heat index in Celsius (isFahreheit = false)
float hic = dht.computeHeatIndex(t, h, false);
return t, h;
}
void conditionalStatements(){
readTempHum();
soilMoisture();
if(t >= 40.00){
digitalWrite(dcFan, HIGH);
}
if (t <= 15.00) {
digitalWrite(dcFan, LOW);
}
// if(h <= 15.00){
// turnOnHumidifier1();
// }
//
// if(h > 50.00) {
// turnOffHumidifier();
// }
if(readSoil < 18){
digitalWrite(dcPump, HIGH);
}
if(readSoil >= 55){
digitalWrite(dcPump, LOW);
}
// Serial.println(readSoil);
// delay(500);
}
int soilMoisture(){
readSoil = analogRead(soilMostureSensor);
readSoil = map(readSoil, 0, 1023, 100, 0);
readSoil = constrain(readSoil, 0, 100);
return readSoil;
}
void loop() {
conditionalStatements();
Blynk.run();
Blynk.virtualWrite(V0, t);
Blynk.virtualWrite(V1, h);
Blynk.virtualWrite(V2, readSoil);
}
This is displayed widgets on the web app. It has three (3) controls namely, the pump button which is a widget that controls the state of the DC pump of the greenhouse model, the temperature control button, which is responsible for turning on the DC fans; and the humidifier button, which controls the humidifier device in the greenhouse model farm. The Blynk web app has three (3) display widgets to monitor and track the state of the temperature, the humidity, and the soil moisture level. This is shown in the image above. The control widgets use a separate function code to send signals to the NodeMCU when they are switched or they change state while the display widgets use a different function in the program code to write to the Blynk cloud to only display.
Thinning, Soldering and Casing the IoT Based Greenhouse Project
Thinning involves the smooth scrapping of terminal components, either by knife or sand paper, before soldering.
Soldering involves the joining of the conductors or components terminals to the circuit board by means of soldering iron and soldering wire. This process was carried out after the terminals of the component have been thinned and positive results have been obtained from the testing of the component.
The casing was made to be a house for some of the components. The casing encased the most of the components and modules use in the project design. It was made from a (3×6) inch pattress box.
The greenhouse model was made using a transparent encasing as shown above. It measured 50cm x 60cm x 40cm in dimension. The model roof was an acrylic glass that was also transparent. The inside of the box was modelled to perform underground irrigation by placing hose running beneath a soil layer. Two openings were cut for the fan inflow of air and outflow of air. This was to control the temperature through natural means. When the greenhouse model was hot or above optimum temperature, cool air was supplied inside.
The greenhouse model was fabricated from a transparent plastic box . It was modelled in such a way that vents were created to allow air passage. Two DC fans were placed on the adjacent sides. This will serve as the extractor fan and the air inlet fan. To control the humidity in the model, a humidifier is mounted at the center of the model. This will automatically and user-based input, control the rate of humid air plants leaves are exposed to.
The Result
The IoT based greenhouse project was made to control the humidity of the plants inside the model greenhouse by increasing the level of moisture around the plants through the spraying of moist air using a humidifier. This is remotely controlled also through the Blynk IoT app. And also controlled automatically by the brain of the project which is the microcontroller. As shown in the image above, the level of water in the soil will determine if the pump should turn on automatically or remain turned off. The user can also control these parameters by online dashboard.
Conclusion
The IoT-based Green House Project has been designed and tested to work. Let us know in the comment section if you were able to replicate this project or if you made some modifications of your own to it.
This project concentrated on selecting an approach that would design an IoT based green house project. The task at hand was to devise and build a greenhouse irrigation model with the ability to inspect, control, and monitor the temperature and humidity of the plant. While regulating the soil level, it will also keep an eye on the moisture level of the soil. The concept was intended to be based on the internet of things (IoT). This implied that it could be managed and observed remotely from anywhere in the world.
The Materials Required for this Project
The table below is the materials required for this project construction. Also we have included the the quantity needed. You can head over to our online shop to get most of the items here.
ITEM DESCRIPTION
QUANTITY
UNIT COST
TOTAL UNIT
LiPo CHARGING MODULE
1
DHT22
1
3×6 INCH PATRESS BOX
1
Connector
3
RESISTORS
2
CONNECTING WIRES
3 yards
Sil Moisture sensor
1
MQ135 SENSOR
1
LIPO BATTERY
1
SOLDER
1
SOLDERING IRON
1
Buzzer
1
NodeMCU Board
1
Acryllic glass
1
Plastic container
1
Plywood board
1
Glue stick
10
DC SWITCH
1
FEMALE HEADERPIN
2
MISCELLANEOUS
table of materials/components needed for the project design
Schematic Diagram for the IoT Based Green House Project
schematic diagram for IoT based green house project
The DC fans are connected in parallel to each other and are energized by an NPN transistor which is fired at the base by an 1k resistor. When the button on the web dashboard is pressed, the received signal indicates the state of the DC fan. Either to baise the base of the transistor or not. The DC pump is also controlled by the transistor since it demands some initial current at start up. The base of the resistor is connected to a 1k resistor that is connected to a GPIO pinon the NodeMCU. When this GPIO pin is high at 3.3V, the base of the transistor is biased, and when it is LOW it is not biased.
The soil moisture level sensor is connected to the only ACD pin on the NodeMCU, this is the A0 pin. The analog output pin (A0) was connected to this A0 on the NodeMCU. And a program was used to read the analog reading of the sensor. Alternatively, you can download the code and schematic diagram from the link here.
Programming the Project (Arduino Sketch)
#define BLYNK_TEMPLATE_ID "xxxxxxxxxxxxxxxx" //replace with your unique ID
#define BLYNK_TEMPLATE_NAME "Green House Project"
#define BLYNK_AUTH_TOKEN "xxxxxxxxxxxxxxxxxxxx" //replace with your token
#include "DHT.h"
// Comment this out to disable prints and save space
#define BLYNK_PRINT Serial
#include <ESP8266WiFi.h>
#include <BlynkSimpleEsp8266.h>
char auth[] = BLYNK_AUTH_TOKEN;
char ssid[] = "Galaxy A51 917E";
char pass[] = "ancsucre21";
#define DHTPIN D3 // Digital pin connected to the DHT sensor
//outline the actuATORS
#define dcFan D6
#define dcPump D8
#define humdifier D5
//state the inputs
#define soilMostureSensor A0
// Uncomment whatever type you're using!
//#define DHTTYPE DHT11 // DHT 11
#define DHTTYPE DHT22 // DHT 22 (AM2302), AM2321
//#define DHTTYPE DHT21 // DHT 21 (AM2301)
DHT dht(DHTPIN, DHTTYPE);
//variables
float h, t, f;
int readSoil, pumpButton, tempButton, humidifierButton;
BLYNK_WRITE(V3) {
pumpButton = param.asInt();
if((readSoil > 19) && (readSoil <= 54)){
if (pumpButton==1){
digitalWrite(dcPump, HIGH);
}
else if(pumpButton==0){
digitalWrite(dcPump, LOW);
}
}
}
BLYNK_WRITE(V4) {
tempButton = param.asInt();
Serial.println(tempButton);
if((t > 19) && (t <= 40)){
if (tempButton==1){
digitalWrite(dcFan, HIGH);
}
else if(tempButton==0){
digitalWrite(dcFan, LOW);
}
}
}
BLYNK_WRITE(V5) {
humidifierButton = param.asInt();
if (humidifierButton==1){
pressHum();
}
else if(tempButton==0){
Serial.println("press again");
}
}
void pressHum(){
digitalWrite(humdifier, LOW);
delay(100);
digitalWrite(humdifier, HIGH);
}
void setup() {
//begin serial comm.
Serial.begin(9600);
//state the actuators as outputs
pinMode(dcPump, OUTPUT);
pinMode(humdifier, OUTPUT);
pinMode(dcFan, OUTPUT);
//turn off humidifier
pressHum();
delay(3000);
pressHum();
delay(3000);
pressHum();
//begin the dht sensor
dht.begin();
Blynk.begin(auth, ssid, pass);
digitalWrite(dcFan, LOW);
}
void turnOffHumidifier(){
pressHum();
delay(3000);
pressHum();
delay(3000);
pressHum();
}
void turnOnHumidifier1(){
pressHum();
}
void turnOnHumidifier2(){
pressHum();
delay(3000);
pressHum();
}
//create a fxn to read the temp and hum
float readTempHum(){
// Reading temperature or humidity takes about 250 milliseconds!
// Sensor readings may also be up to 2 seconds 'old' (its a very slow sensor)
h = dht.readHumidity();
// Read temperature as Celsius (the default)
t = dht.readTemperature();
// Read temperature as Fahrenheit (isFahrenheit = true)
f = dht.readTemperature(true);
// Check if any reads failed and exit early (to try again).
if (isnan(h) || isnan(t) || isnan(f)) {
Serial.println(F("Failed to read from DHT sensor!"));
//return;
}
// Compute heat index in Fahrenheit (the default)
float hif = dht.computeHeatIndex(f, h);
// Compute heat index in Celsius (isFahreheit = false)
float hic = dht.computeHeatIndex(t, h, false);
return t, h;
}
void conditionalStatements(){
readTempHum();
soilMoisture();
if(t >= 40.00){
digitalWrite(dcFan, HIGH);
}
if (t <= 15.00) {
digitalWrite(dcFan, LOW);
}
// if(h <= 15.00){
// turnOnHumidifier1();
// }
//
// if(h > 50.00) {
// turnOffHumidifier();
// }
if(readSoil < 18){
digitalWrite(dcPump, HIGH);
}
if(readSoil >= 55){
digitalWrite(dcPump, LOW);
}
// Serial.println(readSoil);
// delay(500);
}
int soilMoisture(){
readSoil = analogRead(soilMostureSensor);
readSoil = map(readSoil, 0, 1023, 100, 0);
readSoil = constrain(readSoil, 0, 100);
return readSoil;
}
void loop() {
conditionalStatements();
Blynk.run();
Blynk.virtualWrite(V0, t);
Blynk.virtualWrite(V1, h);
Blynk.virtualWrite(V2, readSoil);
}
This is displayed widgets on the web app. It has three (3) controls namely, the pump button which is a widget that controls the state of the DC pump of the greenhouse model, the temperature control button, which is responsible for turning on the DC fans; and the humidifier button, which controls the humidifier device in the greenhouse model farm. The Blynk web app has three (3) display widgets to monitor and track the state of the temperature, the humidity, and the soil moisture level. This is shown in the image above. The control widgets use a separate function code to send signals to the NodeMCU when they are switched or they change state while the display widgets use a different function in the program code to write to the Blynk cloud to only display.
Thinning, Soldering and Casing the IoT Based Greenhouse Project
Thinning involves the smooth scrapping of terminal components, either by knife or sand paper, before soldering.
Soldering involves the joining of the conductors or components terminals to the circuit board by means of soldering iron and soldering wire. This process was carried out after the terminals of the component have been thinned and positive results have been obtained from the testing of the component.
The casing was made to be a house for some of the components. The casing encased the most of the components and modules use in the project design. It was made from a (3×6) inch pattress box.
The greenhouse model was made using a transparent encasing as shown above. It measured 50cm x 60cm x 40cm in dimension. The model roof was an acrylic glass that was also transparent. The inside of the box was modelled to perform underground irrigation by placing hose running beneath a soil layer. Two openings were cut for the fan inflow of air and outflow of air. This was to control the temperature through natural means. When the greenhouse model was hot or above optimum temperature, cool air was supplied inside.
The Result
The IoT based greenhouse project was made to control the humidity of the plants inside the model greenhouse by increasing the level of moisture around the plants through the spraying of moist air using a humidifier. This is remotely controlled also through the Blynk IoT app. And also controlled automatically by the brain of the project which is the microcontroller. As shown in the image above, the level of water in the soil will determine if the pump should turn on automatically or remain turned off. The user can also control these parameters by online dashboard.
Conclusion
The IoT-based Green House Project has been designed and tested to work. Let us know in the comment section if you were able to replicate this project or if you made some modifications of your own to it.
We have developed a Smart Automatic Trash Basket that can detect the presence of people and open automatically, allowing for contact-free trash disposal. The bin is also smart enough to check the depth of the trash inside it. Once the bin is full, it will not open automatically again. Instead, it will emit a beeping sound and direct people to use the next available smart bin or check back later. The bin will also notify waste managers to come and dispose of its contents via SMS and calls. The project design uses electronic components that are inexpensive and easily available in the market.
Smart Automatic Trash Basket
Components used for this project.
1602 LCD
Real Time clock (RTC) module DS3233 type
Servo motor MG997R
Sharp Infrared sensor Module GX1080 model
Sim800L GSM module
Piezo speaker
LCD wires
Some stranded wires
Arduino Uno, or Nano or Standalone Atmega328P board.
Schematic Diagram for the Smart Automatic Trash Basket
The above diagram shows the connection of the microcontroller (MCU) to the sensors. The MCU is using its ADC pins to take the readings. The project has uses an Atmega328P IC chip which is the brain of the project. The rest of the project is connected as peripherals to the project design. This is the standalone dev board, you can order for the copy of the PCB dev board on our website here. You can equally achieve this using your Arduino Nano or Arduino Uno board. The same thing applies to the whole circuitry.
For clocking speed synchronization, the 16MHz crystal oscillator connected at pin 9 and 10 of the Atmega329P IC was used. This, however, doesn’t mean the IC performs program executions this fast. A pair of 22-pF mica capacitors were used to suppress the noise generated by the switch of the internal transistors of the Atmega328P IC. But the Atmega328P IC has a hardware rest pin (pin 1); for this, a pull-up resistor was used to connect to pin 1 of the IC. This is an active LOW pin, and the 10k pull-up resistor supplies a steady 5V HIGH logic to this pin. This pin would reset the program in the programmable Atmeag328P IC when pulled LOW (to the 0V potential). To achieve this reset mode, we connected a momentary pushbutton to pin 1 of the IC chip. This would pull the 5V supply to the ground when depress. But since it is a monostable switch, it would return to its stable state when released. This, in turn, allows the IC to continue its program functions.
The circuit diagram uses the 1602 LCD as display. The LCD module is connected using the 4-bit method as opposed to the 8-bit method. The RS pin is connected to digital pin 10, and the E pin is connected to pin 9.
Programming the Sensors
The program for the hardware part of the project design was written in C and C++ language; using the Arduino Integrated Environment (IDE). To burn (convert to machine language) these programs into the Atmega328P standalone development board, we used the FTDI ISP programmer as shown in the picture above. You can order a copy of the FTDI programmer from our online shop.
Source Code (Arduino Sketch)
#include <SharpIR.h>
#include <SerialGSM.h>
#include <LiquidCrystal.h>
#include <SoftwareSerial.h>
#include <Servo.h>
#include "RTClib.h"
RTC_DS3231 rtc;
char daysOfTheWeek[7][12] = {"Sunday", "Monday", "Tuesday", "Wednesday", "Thursday", "Friday", "Saturday"};
SerialGSM cell(2,3);
char* recepient = "XXXXXXXXXXX";
char aux_string[30];
char phone_number[15];
char received[15];
int length = 11;
// initialize the library with the numbers of the interface pins
LiquidCrystal lcd(10, 9, 16, 17, 11, 15);
//Create a new instance of the library
//Call the sensor "sensor"
//The model of the sensor is "GP2YA41SK0F"
//The sensor output pin is attached to the pin A0
SharpIR sensor( SharpIR::GP2Y0A41SK0F, A0 );
const int trigPin = 6; // Trigger Pin of Ultrasonic Sensor
const int echoPin = 7; // Echo Pin of Ultrasonic Sensor
long duration;
float distance;
String SMS;
boolean sendonce = true;
bool waitTime, firstReminder = false;
bool State = LOW;
bool flag = true;
float cm;
int y;
unsigned int HighByte =0;
unsigned int LowByte = 0;
unsigned int Len =0;
#define piezo 12
Servo myservo;
bool close_bin(int steps = 10, int wait = 10){
lcd.setCursor(0,0);
lcd.print("**Closing Bin.*** ");
lcd.setCursor(0,1);
lcd.print(" Please Wait....");
//delay(500);
for (int pos = 50; pos <= 180; pos += steps) { // goes from 0 degrees to 180 degrees in steps of 1 degree
myservo.write(pos); // tell servo to go to position in variable 'pos'
delay(wait); // waits for the servo to reach the position
}
delay(1000);
return false;
}
bool open_bin(int steps = 10, int wait = 10, int count = 5){
lcd.setCursor(0,0);
lcd.print("**Opening Bin.*** ");
lcd.setCursor(0,1);
lcd.print(" Please Wait....");
for (int pos = 180; pos >= 50; pos -= steps) { // goes from 180 degrees to 0 degrees
myservo.write(pos); // tell servo to go to position in variable 'pos'
delay(wait); // waits for the servo to reach the position
}
delay(500);
lcd.setCursor(0,0);
lcd.print(" ");
while(count > 0){
lcd.setCursor(8,0);
lcd.print(count);
count -= 1;
delay(1000);
}
return false;
}
void sendSMSALert(){
cell.Rcpt(recepient);
delay(500);
Serial.print("Sending mesage to: ");
Serial.println(recepient);
cell.Message("***SMART BIN ALERT***\n__BIN FULL!__\n Trash Basket at Location Wiston and 5th is full. PLS kindly quickly dispose\nEnd of Report!\nHave a Nice Day.");
delay(1000);
cell.SendSMS();
}
bool motion(int average = 10){
int distance = 0;
for(int x = 0; x<= average; x++){
distance += sensor.getDistance();
}
distance /= average;
Serial.println(distance);
if (distance <= 5){
return true;
}
else{return false;}
}
int waste_volume(){
DateTime now = rtc.now();
digitalWrite(trigPin, LOW);
delayMicroseconds(2);
digitalWrite(trigPin, HIGH);
delayMicroseconds(10);
digitalWrite(trigPin, LOW);
duration = pulseIn(echoPin, HIGH);
distance = duration*0.034/2.0;
}
void Date_TIME(){
DateTime now = rtc.now();
lcd.setCursor(0, 1);
lcd.print("DATE: ");
lcd.print(now.day(), DEC);
lcd.print('/');
lcd.print(now.month(), DEC);
lcd.print('/');
lcd.print(now.year(), DEC);
lcd.print(" ");
lcd.setCursor(0, 0);
lcd.print("TIME: ");
lcd.print(now.hour(), DEC);
lcd.print(':');
lcd.print(now.minute(), DEC);
lcd.print(':');
lcd.print(now.second(), DEC);
lcd.print(" ");
}
void setup() {
Serial.begin(9600);
pinMode(trigPin, OUTPUT);
pinMode(echoPin, INPUT);
cell.begin(9600);
cell.Verbose(true);
cell.FwdSMS2Serial();
delay(2000);
pinMode(13, OUTPUT);
pinMode(piezo, OUTPUT);
myservo.attach(8);
if (! rtc.begin()) {
lcd.setCursor(0, 0);
lcd.print("Can't find RTC");
delay(3000);
while (1);
}
if (rtc.lostPower()) {
lcd.setCursor(0, 0);
lcd.print("RTC lost power!");
// following line sets the RTC to the date & time this sketch was compiled
rtc.adjust(DateTime(F(__DATE__), F(__TIME__)));
delay(3000);
}
myservo.write(180);
lcd.begin(16, 2);
lcd.setCursor(3, 0);
lcd.print(" WELCOME");
delay(1000);
lcd.setCursor(2, 0);
lcd.print(" SMART BIN");
lcd.setCursor(3, 1);
lcd.print(" PROJECT");
delay(2000);
lcd.clear();
}
void loop() {
waste_volume();
DateTime now = rtc.now();
Serial.print("dist: ");
Serial.print(distance);
Serial.println(" cm");
y = map(distance, 4.15, 26.20, 100, 0);
y = constrain(y, 0, 100);
Serial.print("y = ");
Serial.println(y);
delay(200);
int a = (constrain(now.second(), 0, 5));
int b= (constrain(now.second(), 11, 15));
int c= (constrain(now.second(), 21, 25));
int d=(constrain(now.second(), 31, 35));
int e=(constrain(now.second(), 41, 45));
int f= (constrain(now.second(), 51, 55));
if(distance >= 4.39){
if(motion() == true){
open_bin();
close_bin(1, 20);
}
digitalWrite(piezo, LOW);
}
if((flag == true) && (motion != true)){
digitalWrite(piezo, LOW);
if((now.second()==a)||(now.second()==b)|| (now.second()==c)|| (now.second()==d)||(now.second()==e)|| (now.second()==f)){
Date_TIME();
}
else{
lcd.setCursor(0, 0);
lcd.print(" SMART BIN ");
lcd.setCursor(0, 1);
lcd.print("WASTE LEVEL:");
if(y<100){
lcd.print(" ");
}
lcd.print(y);
lcd.print("%");
}
}
if((distance < 4.99) && (motion() == true)){
lcd.setCursor(0, 0);
lcd.print("SORRY SMART BIN");
lcd.setCursor(0, 1);
lcd.print("......FULL......");
digitalWrite(piezo, HIGH);
if((now.minute() == 30) || (now.minute() == 59)){
waitTime = true;
Serial.println(now.minute());
sendSMSALert();
waitTime = false;
}
}
while ((distance < 4.99) && (firstReminder == false)){
sendSMSALert();
firstReminder = true;
}
}
Code Explanation of Smart Automatic Trash Basket
In the beginning of the code we imported different libraries that was necessary for this particular design. On line 1, we imported the sharpIR library (lib) which is responsible for taking accurate measurement by the infrared distance sensor. At line three, we imported the serial GSM library known as SerialGSM.h. the .h format shows that it is a header file. Next, with the software serial lib to detect or to call where we connected the GSM module pin. So since we used a servo motor for this particular design, we included a Servo library also and also the Real time Clock (RTC) library. Here, we are using an RTC type ds3231. Next, we defined the days of the week in a dictionary or string array type. Our serial GSM shows which of the microcontroller pins we connected the transmit and receive pins of the GSM module. We connected the transmit pain to the Digital pin of a microcontroller and receiver pin to do digital three on a microcontroller. A string character was declared to take the recipient’s phone number. The use of the LCD 16 by 2 module was very important and for its use, we are going to be using the four bits communication protocol. This means that it is going to be using for digital pins on the microcontroller for data transmission; another digital pin for registered select and one digital pin for enable. Our infrared distance sensor is connected to the analog pin of the microcontroller and this is the analog pin zero (A0). To detect the distance or the height of the waste in the bin basket, ultrasonic sensor pins the trigger pin and echo were connected to digital pin 6 and 7 respectively on the microcontroller. A string type of character known as SMS was defined and we used a boolean algebra to set true for only sending once the SMS to waste management. W created the function called closebin; in this we used a for Loop to move the servo through an angle of 0 to 80 degrees. Another function known as open_bin() was created to do the reverse of this Close_bin(). This time, in a delay increment of 10 MS. Since the smart bin was supposed to open and hold for 5 seconds a countdown of 5 Seconds was to be displayed on the screen.
This was taken care of by the while loop count to print from 1 to 5 in a countdown order. Once the number hits zero on the LCD screen, the lid is automatically closed by the microcontroller. Another function known as sendSMS alert was used to send SMS about the status of the trash. This SMS will contain the level of the trash; that is, if it is full and a location of where the smart bin was located. A function known as motion() was used to detect the presence of human being in front of the smart bin design. In it we used the for Loop to get distance between the person and the infrared distance sensor. On taking average measurements of various distance of object or human beings that emitted infrared radiation. If the distance was less than or equal to 5 cm, the motion sensor will return true boolean logic to the microcontroller and this will then check if the big basket has enough empty space to collect waste. If it did, it will open and user will dispose off his waste. The waste volume function uses the trigger and echo pins to take measurements of the volume of waste in the smart bin.
Construction & Assembly of the Smart Automatic Trash Basket
The construction of the Smart Bin design was done using soldering and coupling of active circuits. The soldering was done on the VERO Board using a 40-watt soldering iron, and the components were properly arranged by following the designed circuit diagram of the project.
Thinning
Thinning involves the smooth scrapping of terminal components, either by knife or sand paper, before and after soldering.
Soldering
Soldering involves the joining of the conductors or component terminals to the circuit board by means of soldering iron and soldering lead. This process was carried out after the terminals of the component had been thinned and positive results had been obtained from the testing of the component.
Assembly of Components
The number of components determined the size of the VERO board used, and in dimensioning the size of the board, allowance is given for the arrangement if the need arises.
Testing of Smart Automatic Trash Basket
The project design worked as expected. It was performed as we programmed and optimized it to be. The wastes that was usually littered around trash baskets when they were filled up has been curbed since the trash basket doesn’t open for users but instead notifies them that it is currently full and is waiting for the waste management team to come and dispose of its content and they users can check back later.
Conclusion
Having achieved a smart bin that has the capacity of detecting the presence of human beings, opening the lead with no contact whatsoever and allowing people to dispose of trash effectively. The Smart Automatic Trash Basket project will be smart enough to check the depth of the trash that is inside it; then once full, the bin won’t automatically open again for people to dispose of trash. But rather would send a beeping sound and direct them via their smart LCD screen to use the next available smart bin or check back later. Finally, it will notify the waste managers to come and dispose off its content.
This IoT based project uses an NPK sensor to measure the soil nutrient available in the soil and then displays it in an OLED as well as sending the read soil values to Blynk IoT dashboard as shown above. The project is very important to agriculture and gardening practices.
IoT NPK Fertility Analyzer – The Components Required
The following are the materials used for this IoT NPK project tutorial.
IoT Based NPK Sensor Project – Assembling the components
The IoT based NPK fertilizer analyzer project was first assembled using the breadboard, as shown above. The breadboarding phase allowed for the testing of of the project tutorial, giving room for error making and modification. The setting up and connection of the components on the breadboard is done following the schematic diagram shown below.
IoT Based NPK Sensor Project – Schematic Diagram
Schematic diagram of IoT Based NPK sensor Project
Explanation of the Schematic Diagram
The pictorial schematic diagram shown above, has exclusion of the power connection. We only focused the connection of the 5V coming out from the DC-DC buck converter. The 12V power supply is fed into the PCB socket (shown in green).
The ESP8266-01 (ESP-01) module is connected to the Arduino Nano board using serial communication since the Blynk IoT platform to be used here doesn’t work well with the I2C communication. Hence, the OLED doesn’t work with the libraries of Blynk when using the both of them on the same Arduino board.
To solve this problem, we used the ESP-01 as a microcontroller instead of a module, then we used serial communication protocol to talk to it through the Arduino Nano. The Arduino Nano would do the job of taking the readings of the soil fertility through the NPK sensor, displaying these sensor readings on the OLED module and sending it through serial to the ESP-01, who would in turn send it to the Blynk dashboard.
The MAX485 module helps us maintain a RS485 to TTL communication between the NPK sensor and the Arduino. The MAX485 module uses the 5V logic from the Arduino to power itself and it is connected as shown below.
Powering the Circuitry
The system itself uses 12V DC power from a 12V adapter. The adapter is first stripped of its casing and made in such a way that it can fit into a 3×6″ box. The adapter 12V DC output is connected to the 12V input of the NPK power rails and also to the input of the DC-DC buck converter. This is bucked down to 5V for the Arduino Nano board and the MAX485 module. The AC input to the adapter is connected to the AC load point through power plug. This was made in such a way that is can be detachable.
Programing the IoT NPK Project Design
The programming of this project was using Arduino IDE. The source code is found in the link here. You can also copy the one in the code snippet and paste it into your Arduino IDE and run it. Since the Arduino Nano does the sensor reading and calculation and displays these readings on the OLED the same time it sends the said readings to the ESP-01 snesor who would send it to the IoT Blynk platform.
The transmitter Arduino sketch allows us to use the serial communication protocol to communicate with the MAX485 module to read the NPK sensor. This shows where the Transmitter and receiver pins of the MAX485 module is connected on the Arduino Nano board. The sketch uses 5 libraries to make the whole setup function perfectly for the Arduino Nano side.
In the setup() function, we enabled the OLED function and displayed a welcome message and after a period of 3 seconds we cleared the screen. The program then checks to see of the NPK sensor is connected. And if it was connected, it will display that it was connected hence proceed to take the sensor readings of the soil levels for Nitrogen, Phosphorus and Potassium. This is printed out on the serial monitor and also sent to the ESP-01 MCU since the Arduino Nano baords communicate to the ESP-01 via hardware serial communication and this is enabled the moment we enabled serial communication in the setup().
However, The method of sending this type of data required a special approach so that it can be parsed easily by the receiving end. We had to use special alphabets to concatenate the strings being sent to the serial buffer.
The Arduino Code – The Receiver Side (ESP-01 MCU)
#include <SoftwareSerial.h>
SoftwareSerial esp(4,5);
const byte numChars = 32;
char receivedChars[numChars];
char tempChars[numChars]; // temporary array for use when parsing
boolean newData = false;
// variables to hold the parsed data
char messageFromPC[numChars] = {0};
int n, p, k = 0;
static boolean recvInProgress = false;
static byte ndx = 0;
char startMarker = '<';
char endMarker = '>';
char rc;
void recvData(){
}
void setup(){
// Debug console
Serial.begin(115200);
esp.begin(115200);
}
void loop(){
recvWithStartEndMarkers();
if (newData == true) {
strcpy(tempChars, receivedChars);
// this temporary copy is necessary to protect the original data
// because strtok() used in parseData() replaces the commas with \0
parseData();
showParsedData();
newData = false;
}
}
void recvWithStartEndMarkers() {
while (esp.available() > 0 && newData == false) {
rc = esp.read();
if (recvInProgress == true) {
if (rc != endMarker) {
receivedChars[ndx] = rc;
ndx++;
if (ndx >= numChars) {
ndx = numChars - 1;
}
}
else {
receivedChars[ndx] = '\0'; // terminate the string
recvInProgress = false;
ndx = 0;
newData = true;
}
}
else if (rc == startMarker) {
recvInProgress = true;
}
}
}
//============
void parseData() { // split the data into its parts
char * strtokIndx; // this is used by strtok() as an index
strtokIndx = strtok(tempChars,","); // get the first part - the string
strcpy(messageFromPC, strtokIndx); // copy it to messageFromPC
strtokIndx = strtok(NULL, ","); // this continues where the previous call left off
n = atoi(strtokIndx);
strtokIndx = strtok(NULL, ",");
p = atoi(strtokIndx); // convert this part to a float
strtokIndx = strtok(NULL, ","); // this continues where the previous call left off
k = atoi(strtokIndx); // convert this part to an integer
Serial.print(" N: ");
Serial.print(n);
Serial.print(" P: ");
Serial.print(p);
Serial.print(" K: ");
Serial.println(k);
}
//============
void showParsedData() {
Serial.print(" N: ");
Serial.print(n);
Serial.print(" P: ");
Serial.print(p);
Serial.print(" K: ");
Serial.println(k);
}
Explanation of Arduino Sketch (Receiver Side)
This source code explains how we used software serial comm. to received the sent data strings from the Arduino Nano. We used the logic above to parse the data sent and then sent this data to the Blynk IoT Dashboard. This is a smart and cost effective way to solve the Blynk and OLED libraries issues. Since, the both of them can’t run together on the same ARDUINO UNO AND NANO BOARDS.
Setting up the Blynk IoT Platform
You can check out any of these previous blog links below on how to set up the Blynk dashboard. If you still can’t get it done. Kindly leave a comment below.
When the coupling and tidying up was completed, we used a white wrapper to cover the top enclosure making a bit flashy. The OLED screen is made to show on the top cover. There is a pushbutton on the side to reset the microcontroller to take new readings on insertion of the sensor probe into a new soil sample. And the sensor connection is made detachable to make it plug-N-play.
IoT based NPK project
The ESP-01 MCU would take these readings to the Blynk cloud platform and display them on the dashboard as shown above. The readings will be updated the moment the sensor senses new soil parameters.
Kindly note that the NPK sensor can be quite frustrating to use. Kindly get an original copy for this project to work. IF possible, get the type that has a UART USB reader that can be first tested using a PC program before using it with the MAX485 module.
Conclusion
The project tutorial teaches how to use Soil NPK sensor to monitor the soil fertility concentrations. Soil parameters like the Nitrogen, Phosphate and Potassium concentration level can be remotely monitored on an IoT Blynk platform.
In this post today, we will be doing a temperature control fan simulation using Arduino and Proteus Design and Circuit IDE. This post is a continuation of of our previous Home Automation Simulation. In the previous post, we were able to turn on and off the light bulb using the PIR motion sensor. In this very post, we will be adding a digital and humidity sensor (DHT11) to sensor the virtual temperature of the room and hence regulate the temperature by ensuring that when the temperature goes too hot, the fan increases its speed to the maximum and when the temperature is too cold, the fan’s speed decreases until it finally turns off.
Temperature Fan Control Simulation
To proceed further on this, we are assuming that you have the knowledge of how to install the Proteus version used in this tutorial by reading the previous post and also how to create a new project on Proteus Design and Circuit IDE. It is pretty much easy, just follow the previous blog post.
The Components Needed
The Proteus components needed for this tutorial is listed in the image above. You can just type the exact part number or model names as show there. However in summary we used the Zener diode 1M110Z5S as flywheel for the relay module created with the NPN transistor. The Arduino Uno is the heart and brain of the simulation. We used a push-button and a switch to to give the user control over the fan and the simulated room light bulb. This means that if the user wanted the fan to be turned on and regulated by the internal temperature sensor (DHT11), he/she could just press the switch. But the light bulb is triggered by the motion sensor automatically. However if the user wanted the light bulb to remain turned off, he/she could just push the push-button.
The connection to the whole components is shown in the above diagram, we just need to add a few components to our last tutorial. We needed the DHT11 sensor and this can be gotten from the search menu after we click on pick component icon. The DC fan too and the extra NPN transistor that was connected to it. We used a 12V power supply to power it.
Programming the Proteus Simulation
The Arduino Sketch
The Arduino sketch to this design is found in the simulation folder on Github. You can download the file and unzip, and open it in your Arduino IDE. Alternatively, you can also just copy the code off here.
// include the library code:
#include <LiquidCrystal.h>
#include "DHT.h"
//show where the actuator and sensors are connected
#define pirPin 8
#define pushButtonPin 9
#define relayPin 10
int fanSwitch = 11;
int fanControl = A0;
//show where the dht11 sensor was connected
#define DHTPIN 12
#define DHTTYPE DHT11 // we are using DHT11
DHT dht(DHTPIN, DHTTYPE);
// Variables will change:
int ledState = HIGH; // the current state of the output pin
int buttonState; // the current reading from the input pin
int lastButtonState = LOW; // the previous reading from the input pin
unsigned long lastDebounceTime = 0; // the last time the output pin was toggled
unsigned long debounceDelay = 10; // the debounce time; increase if the output flickers
// state where the arduino pin number it is connected to on LCD
const int rs = 2, en = 3, d4 = 4, d5 = 5, d6 = 6, d7 = 7;
LiquidCrystal lcd(rs, en, d4, d5, d6, d7);
void setup() {
// set up the LCD's number of columns and rows:
lcd.begin(16, 2);
//begin the serial monitor comm.
Serial.begin(9600);
//beging the dht11 sensor
dht.begin();
//state the fxn for the inputs and outputs
pinMode(pirPin, INPUT);
pinMode(pushButtonPin, INPUT_PULLUP);
pinMode(relayPin, OUTPUT);
pinMode(fanSwitch, INPUT_PULLUP);
pinMode(fanControl, OUTPUT);
// Print a welcome message to the LCD.
lcd.setCursor(0, 0);
lcd.print("HELLO THERE?");
delay(100);
lcd.clear();
lcd.setCursor(0, 0);
lcd.print("MOTION BASED");
lcd.setCursor(0, 0);
lcd.print("HOME AUTOMATION");
delay(100);
lcd.clear();
lcd.setCursor(0, 0);
lcd.print("SIMULATION");
delay(100);
lcd.clear();
//read the pir sensor
while (digitalRead(pirPin) == 0) {
lcd.clear();
lcd.setCursor(0, 0);
lcd.print(" NO MOTION");
lcd.setCursor(0, 1);
lcd.print("DETECTED IN ROOM");
Serial.println("NO MOTION DETECTED");
delay(50);
turnOffBulb();
delay(100);
}
if (digitalRead(pirPin) == 1) {
lcd.clear();
lcd.setCursor(0, 0);
lcd.print("MOTION DETECTED");
Serial.println("MOTION DETECTED");
delay(50);
turnOnBulb();
delay(100);
}
}
void turnOnBulb() {
digitalWrite(relayPin, HIGH);
Serial.println("LIGHT BULB TURNED ON");
lcd.clear();
lcd.setCursor(0, 0);
lcd.print("LIGHT BULB");
lcd.setCursor(0, 1);
lcd.print("TURNED ON");
}
void turnOffBulb() {
digitalWrite(relayPin, LOW);
Serial.println("LIGHT BULB TURNED OFF");
lcd.clear();
lcd.setCursor(0, 0);
lcd.print("LIGHT BULB");
lcd.setCursor(0, 1);
lcd.print("TURNED OFF");
}
void controlFan() {
float h = dht.readHumidity();
// Read temperature as Celsius (the default)
float t = dht.readTemperature();
// Read temperature as Fahrenheit (isFahrenheit = true)
float f = dht.readTemperature(true);
//print out the readings
Serial.print(F("Humidity: "));
Serial.print(h);
Serial.print(F("% Temperature: "));
Serial.print(t);
Serial.print(F("°C "));
Serial.println(digitalRead(fanSwitch));
lcd.clear();
lcd.setCursor(0, 0);
lcd.print("T: " +String(t, 1)+ "'C H: " + String(h,0) + "%");
if (digitalRead(fanSwitch)== 1) {
if (t > 37.00) {
for (int i = 50; i < 256; i++) {
analogWrite(fanControl, i);
lcd.setCursor(0, 1);
lcd.print("FAN ON");
}
}
if (t < 35.00) {
analogWrite(fanControl, LOW);
lcd.setCursor(0, 1);
lcd.print("FAN OFF");
}
}
if (digitalRead(fanSwitch) == 0) {
analogWrite(fanControl, LOW);
lcd.setCursor(0, 1);
lcd.print("FAN OFF");
}
}
void loop() {
//read the pir sensor
bool readPir = digitalRead(pirPin);
// read the state of the switch into a local variable:
int reading = digitalRead(pushButtonPin);
controlFan();
delay(100);
// If the switch changed, due to noise or pressing:
if (reading != lastButtonState) {
// reset the debouncing timer
lastDebounceTime = millis();
}
if ((millis() - lastDebounceTime) > debounceDelay) {
// if the button state has changed:
if (reading != buttonState) {
buttonState = reading;
// only toggle the LED if the new button state is HIGH
if (buttonState == HIGH) {
ledState = !ledState;
}
}
}
//use an if condition to check for the motion
if (ledState == 0) {
if (readPir == 1) {
lcd.clear();
lcd.setCursor(0, 0);
lcd.print("MOTION DETECTED");
Serial.println("MOTION DETECTED pushbutton: " + String(reading) + " LED state: " + String(ledState));
delay(50);
turnOnBulb();
delay(100);
}
}
if (ledState == 1) {
if (readPir == 1) {
lcd.clear();
lcd.setCursor(0, 0);
lcd.print("MOTION DETECTED");
lcd.setCursor(0, 1);
lcd.print("USER OFF LIGHT");
Serial.println("MOTION DETECTED pushbutton: " + String(reading) + " LED state: " + String(ledState));
delay(50);
turnOffBulb();
delay(100);
}
if (readPir == 0) {
lcd.clear();
lcd.setCursor(0, 0);
lcd.print("NO MOTION DETTED");
lcd.setCursor(0, 1);
lcd.print("USER OFF LIGHT");
Serial.println("NO MOTION DETECTED pushbutton: " + String(reading) + " LED state: " + String(ledState));
delay(50);
turnOffBulb();
delay(100);
}
}
// save the reading. Next time through the loop, it'll be the lastButtonState:
lastButtonState = reading;
delay(100);
}
Explanation of The Arduino Code
We began by including the LCD library. This is needed to show the user what is going on in the simulated virtual room. We also included the library for the temperature sensor, DHT11 in code line 3. We declared and defined where we connected the PIR sensor digital output pin (which is digital pin 8). The relay transistor base is connected to digital pin 10 on the Uno board, the Fan Auto Mode switch is connected to D11, while the DHT11 digital output pin is connected to D12 on the virtual Arduino Uno board. This as shown from code line 6 through 12.
We used dome variables to hold the states of the AC light bulb so as to allow the user change the turning on and off of the bulb. These variables in code line 19 and 21 helps us to enable the user to turn off the light bulb when the motion sensor triggers it on and it stays off. And turns back on when the user presses it and for it to sense motion and come on. The code line 28 is where we connected the LCD digital pins onto the Arduino Uno board pins.
Arduino Hex Code
The HEX code is located at the Arduino IDE output console, as stated in the previous post, just copy this address to the HEX code. And paste it into the Arduino Uno by doubleclicking on the components and pasting it into the ‘program file’ input.
Once this is done, we can proceed to the next step which is actually running the simulation by moving down to the lower panel and click on the play button. This would take just about 1-2 seconds. And the temperature control fan simulation should start running if you got everything connected properly and both the HEX file addresses for the PIR sensor and Arduino Uno set properly.
As show below, the simulation would show the temperature of the virtual room and the humidity in degree Celsius and percentage respectively. It will also show the current state of the fan. It is either turned on or off.
To simulate the temperature changes, we go to the DHT11 sensor component while the simulation is still running. Please note that the simulation may not be running in real time. This is not really a problem since we can still simulate what we intended to do.
Clicking on any of the two buttons as highlighted out above would change the printed temperature sensed by the DHT11 sensor. The up arrow button increases the temperature whereas the down button decreases the temperature.
However, if the switch shown above is not turned on (pressed down), the fan won’t start spinning. But if it is as, as shown above, then we can expect the DC fan to rotate. Also, the speed of the fan is controlled by the temperature of the DHT11 sensor. According to the program written, when the temperature is above 37 degree Celsius, the Fan automatically go into activation and would be running at a speed controlled by PWM signal feed into the base of the NPN transistor. And if the temperature is below 35 degrees Celsius, the Fan would automatically stop. These set temperatures are the human body temperatures that are medically know to cause cold and hot.
Conclusion
We have so far, in this temperature control fan simulation post, designed and simulated a home automation system that uses the PIR motion sensor to turn on the virtual room light and also used a digital and humidity sensor DHT11 to control the speed of the fan running in the virtual room. All the components and simulation is running smoothly. Let us know if you remade this on your own or if you added any modifications in the comment section. You can also watch the YouTube video to see the demonstration.
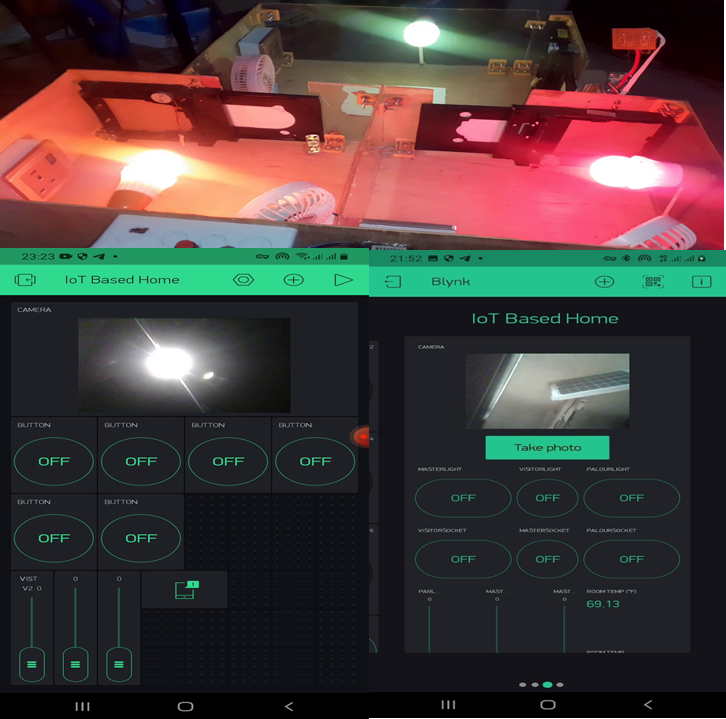
This project design is an IoT (Internet of Things), smart home automation and surveillance project that was based on using Telegram and Blynk servers to host home automation controls and surveillance procedures. The project is designed and programmed around a two-bedroom flat model home. The entrance has a motion triggered visitor camera made from the famously low cost ESP32 cam. Each of the bedrooms, including the sitting room, lightings and load points are controlled remotely via an IoT Blynk dashboard. The system is programmed to to alert the owner of the home of any visitor at the entrance door through a telegram alert. The project design is meant to work as follows, in summary:
Use the motion sensor to trigger a telegram alert that is sent to your phone any time a visitor is at the entrance door.
The owner can put out his/her phone on such notification and open the Blynk, from where
Controls the home appliances through the Blynk app dashboard and from there, take another view of the visitor, if it is someone he/she wants to come inside his house, he can open the door, for the person remotely.
Captures an image of picture of the visitor at the entrance door and displays it on the image widget on telegram and send a backup copy to the telegram app channel.
The system also allow for auto opening of the doors to each rooms form the Blynk app driectly.
The speed control for ventilations from all of the fans in the room are controlled on the Blynk app.
All load points that is AC sockets are controlled remotely too from the app.
Introduction
Home automation refers to the use of technology to control and automate various aspects of a home, such as lighting, heating, and appliances. This can be done through the use of smart devices, such as smartphones or tablets, which can be used to remotely control and monitor these systems. Home automation systems can also be integrated with other smart devices, such as voice assistants, to provide a more seamless and convenient user experience.
Home surveillance, on the other hand, refers to the use of technology to monitor and secure a home. This can be done through the use of cameras and other sensors, which can be used to detect and deter intruders, as well as to monitor the comings and goings of people and pets. Some home surveillance systems also include features such as motion detection and facial recognition, which can be used to alert homeowners of potential threats and to automatically trigger an alarm.
When combined, home automation and surveillance can provide a powerful and comprehensive solution for securing and managing a home. Smart cameras, for instance, can be integrated with home automation systems to allow homeowners to monitor their home remotely and to control lighting and appliances in response to motion detection. Similarly, home automation systems can be integrated with surveillance systems to automatically trigger an alarm when an intrusion is detected.
The two dev boards used in this project was ESP32 dev board and ESP32 Cam
The circuit diagram is divided into two parts, namely; the IoT home automation part that is built around the famous ESP32 development board. And the IoT surveillance system part that is built around the ESP32 Cam development board. The system is powered by a 12V power supply to run the three Direct Current (DC) motors that are connected to to the motor driver module L293. Since the ESP32 development board works on 5V, a DC-DC buck converter was needed to step this 12V to 5V.
The motor driver module
The two DC motor driver modules are powered by the 12V power supply, motor driver module one was used to drive two model doors used for the rooms other than the sitting room. The other motor driver was used to control the movement of the door leading to the sitting room. The directional movement of these DC motors would cause opening and closing effects on the doors, making them sliding doors that can be controlled remotely via an app.
The sliding doors were made from two DVD motor tray mechanisms
The first motor driver module was connected 4 input pins to control the two DC motors (model doors). This is shown in the circuit diagram above. These input pins come from the ESP32 dev board. Whereas the second motor driver module as only 2 input connection to the ESp32 dev board. This is because it only controls one model door which is the entrance door to the sitting room.
The circuit diagram shows that a logic inverter was made from a simple transistor circuit that allowed the motor driver to receive 5V HIGH and 0V LOW from the ESP32 Dev board rather than the usual 3.3V and 0V logic level.
The Actuators
These are mainly made of solid state relay modules designed with logic inverters that would help switch the states of the AC light bulbs and the load point AC sockets. The relay module was custom built by us to be a 6-channel relay module that controls the 3 load point sockets and the the 3 lightening bulbs in the rooms.
Since the solid state relay works on 5V logic, the ESP32 dev board can only output 3.3V logic. We also used the logic inverter/amplifier to convert this to 5V. This also meant however that, when the ESP32 dev board sends an output of 3.3V, the inverter inverts this to give 0V. Whereas when the ESP32 dev board sends a logic output, the inverter converts this to 5V high.
The AC actuators are wired to in such a way that the neutral are connected together while the Live (L) wires are connected through the solid state relay. This is shown in the circuit diagram shown above. The solid state relay is energized when the user presses the button on the app or sends a command through the Telegram app.
The Surveillance System
This part of the project was made with the ESP32 Cam and the PIR motion sensor. The ESP32 Cam was connected to the output signal pin of the PIR sensor so that once it senses the presence of a person, it can trigger the ESP32 Cam to take a picture. Once this picture is taken, it is sent to the Telegram as a cloud based backup and also a copy is sent to the Blynk image widget.
Designing The Control Blynk App
This project used the Blynk legacy app but if you want to use the latest version of Blynk, contact us here. See this blog post on how to create an app on the Blynk platform. The design here used the image widget where the images taken when the “take photo” button is pressed. It displays the picture taken by the ESP32 Cam on this app. Thereby letting the user know who is at the entrance door.
The app design has six (6) control pushbuttons for the home appliances connected in the model house. The first upper three pushbuttons were used to control the lightnings in the rooms. While the lower 3 pushbuttons were used to control the loadpoint sockets.
Three (3) slider widgets were used to control the speed of the fans that are place in the room. The slier widgets keeps the fan speeds at maximum when the slider buttons are place at the very vertical tops. Whereas when they are moved down to the bottom, it reduces the fans’ speeds until they come to a stop.
To control the direction of the doors in the rooms, three other pushbuttons were added. These pushbuttons are placed horizontally and are much larger in side than previous one. These pushbuttons were labelled “OPEN ” and “CLOSE”. When the door is closed, the pushbutton widget would display, Open. and it is opened, the pushbutton widget would display Close.
The app design also has an app notifier and a room temperature display widget that can display the room temperature in the house. This is shown in the picture above as the temperature is both displayed in both Celsius and Fahrenheit degrees.
The Telegram Bot App
The project design used the Telegram bot to alert the user of any visitor at the entrance door and also to save the captured picture of such visitor with timestamp as backup. To create this Telegram bot is quite easy.
The BotFather bot
For the project to have authorized user access, a telegram bot was created to have the choice of arming and disarming the project design. To do this we had to create a bot using botFather.
Creating a new bot named ajibade_bot using botfather
The Botfather is a chat bot that allowed us to create our own custom bot. The bot father had commands that would start it and end the chat with users. When it is sent “/start”, it returns some options from which new commands can be sent. This allowed us to get the API key when we put in the program we uploaded into the ESP32 Cam and ESP32. With this API key, we can assign admin role to users who have access to this bot. such that they can send commands to it and receive feedbacks remotely.
Modelling the Project Design
The home model for the project design
The IoT home automation and surveillance system was constructed on a stripboard by assembling the components accordingly before soldering with solder and soldering iron. The 3D model was done on a flat board with dimensions measured out accordingly as shown in the picture above.
The model house when tested
The demo modelling was done on a plywood board. For the demonstration of this project, a plywood of thickness 0.5” (inches) with dimension 40cm by 28.5cm ; was cut out, its surface further smoothened.
Casing the Control Box
The casing was made to be a house model shown in the figure 3.25 below. The casing encased the most of the components and modules use in the project design. It was made from a (6×6)” pattress box. The power supply adaptor was screwed to the side so as to get easy access to DC power supply into the box.
The Arduino Source Code
The Arduino source code for this project design is into parts namely, the Arduino source for the ESP32 Dev board and the Arduino source code for the ESP32 Cam board.
#include <Arduino.h>
#include "esp_camera.h"
#include <WiFi.h>
#include <WiFiClient.h>
#include <WiFiClientSecure.h>
#include "soc/soc.h"
#include "soc/rtc_cntl_reg.h"
#include <BlynkSimpleEsp32.h>
#include <UniversalTelegramBot.h>
#include <ArduinoJson.h>
const char* ssid = "AncII";
const char* password = "eureka26";
String chat_id;
//auth key sent by Blynk
char auth[] = "ghGtzWtTrA9-0uQWOps2GtHqBFWa1tlQ";
// Initialize Telegram BOT
String BOTtoken = "5240120857:AAHGuPezJsephsTtGccZ3MfObsgO6qjtaYU"; // your Bot Token (Get from Botfather)
// Select camera model
#define CAMERA_MODEL_AI_THINKER // Has PSRAM
#include "camera_pins.h"
#define PIR 13
#define LED 4
String CHAT_ID = "746723461";
bool sendPhoto = false;
bool armed = false;
bool flashState = 0;
WiFiClientSecure clientTCP;
UniversalTelegramBot bot(BOTtoken, clientTCP);
//Checks for new messages every 1 second.
int botRequestDelay = 1000;
unsigned long lastTimeBotRan;
String local_IP;
void startCameraServer();
void configInitCamera(){
camera_config_t config;
config.ledc_channel = LEDC_CHANNEL_0;
config.ledc_timer = LEDC_TIMER_0;
config.pin_d0 = Y2_GPIO_NUM;
config.pin_d1 = Y3_GPIO_NUM;
config.pin_d2 = Y4_GPIO_NUM;
config.pin_d3 = Y5_GPIO_NUM;
config.pin_d4 = Y6_GPIO_NUM;
config.pin_d5 = Y7_GPIO_NUM;
config.pin_d6 = Y8_GPIO_NUM;
config.pin_d7 = Y9_GPIO_NUM;
config.pin_xclk = XCLK_GPIO_NUM;
config.pin_pclk = PCLK_GPIO_NUM;
config.pin_vsync = VSYNC_GPIO_NUM;
config.pin_href = HREF_GPIO_NUM;
config.pin_sscb_sda = SIOD_GPIO_NUM;
config.pin_sscb_scl = SIOC_GPIO_NUM;
config.pin_pwdn = PWDN_GPIO_NUM;
config.pin_reset = RESET_GPIO_NUM;
config.xclk_freq_hz = 20000000;
config.pixel_format = PIXFORMAT_JPEG;
//init with high specs to pre-allocate larger buffers
if(psramFound()){
config.frame_size = FRAMESIZE_UXGA;
config.jpeg_quality = 10; //0-63 lower number means higher quality
config.fb_count = 2;
} else {
config.frame_size = FRAMESIZE_SVGA;
config.jpeg_quality = 12; //0-63 lower number means higher quality
config.fb_count = 1;
}
// camera init
esp_err_t err = esp_camera_init(&config);
if (err != ESP_OK) {
Serial.printf("Camera init failed with error 0x%x", err);
delay(1000);
ESP.restart();
}
// Drop down frame size for higher initial frame rate
sensor_t * s = esp_camera_sensor_get();
if (s->id.PID == OV3660_PID) {
s->set_vflip(s, 1); // flip it back
s->set_brightness(s, 1); // up the brightness just a bit
s->set_saturation(s, -2); // lower the saturation
}
s->set_framesize(s, FRAMESIZE_CIF); //UXGA|SXGA|XGA|SVGA|VGA|CIF|QVGA|HQVGA|QQVGA
}
void handleNewMessages(int numNewMessages) {
Serial.print("Handle New Messages: ");
Serial.println(numNewMessages);
for (int i = 0; i < numNewMessages; i++) {
chat_id = String(bot.messages[i].chat_id);
if (chat_id != CHAT_ID){
bot.sendMessage(chat_id, "Unauthorized user", "");
continue;
}
// Print the received message
String text = bot.messages[i].text;
Serial.println(text);
String from_name = bot.messages[i].from_name;
if (text == "/start") {
armed = true;
Serial.println("system armed");
String welcome = "Welcome , " + from_name + "\n";
welcome += "Use the following commands to interact with the ESP32-CAM \n";
welcome += "/photo : takes a new photo\n";
welcome += "/flashLightOn : turn on flash \n";
welcome += "/flashLightOff : turn off flash \n";
bot.sendMessage(CHAT_ID, welcome, "");
}
if (text == "/flashLightOn") {
digitalWrite(LED, HIGH);
Serial.println("flash LED on");
String flashStatus = "Sir " + from_name + "\n";
flashStatus += "flash of ESP32-CAM turned on \n";
bot.sendMessage(CHAT_ID, flashStatus, "");
}
if (text == "/flashLightOff") {
digitalWrite(LED, LOW);
Serial.println("flash LED off");
String flashStatus = "Sir " + from_name + "\n";
flashStatus += "flash of ESP32-CAM turned off \n";
bot.sendMessage(CHAT_ID, flashStatus, "");
}
if (text == "/photo") {
sendPhoto = true;
Serial.println("New photo request");
}
}
}
void takePhoto(){
digitalWrite(LED, HIGH);
delay(200);
uint32_t randomNum = random(50000);
Serial.println("http://"+local_IP+"/capture?_cb="+ (String)randomNum);
Blynk.setProperty(V1, "urls", "http://"+local_IP+"/capture?_cb="+(String)randomNum);
digitalWrite(LED, LOW);
delay(1000);
}
BLYNK_WRITE(V5){
// Set incoming value from pin V0 to a variable
int buttonValue = param.asInt();
Serial.println(buttonValue);
if(buttonValue == 1){
Serial.println("Capture Photo");
takePhoto();
delay(3000);
Serial.println("sending photo to telegram");
sendPhoto = true;
}
}
String sendPhotoTelegram() {
const char* myDomain = "api.telegram.org";
String getAll = "";
String getBody = "";
camera_fb_t * fb = NULL;
fb = esp_camera_fb_get();
if(!fb) {
Serial.println("Camera capture failed");
delay(1000);
ESP.restart();
return "Camera capture failed";
}
Serial.println("Connect to " + String(myDomain));
if (clientTCP.connect(myDomain, 443)) {
Serial.println("Connection successful");
String head = "--Anc\r\nContent-Disposition: form-data; name=\"chat_id\"; \r\n\r\n" + CHAT_ID + "\r\n--Anc\r\nContent-Disposition: form-data; name=\"photo\"; filename=\"esp32-cam.jpg\"\r\nContent-Type: image/jpeg\r\n\r\n";
String tail = "\r\n--Anc--\r\n";
uint16_t imageLen = fb->len;
uint16_t extraLen = head.length() + tail.length();
uint16_t totalLen = imageLen + extraLen;
clientTCP.println("POST /bot"+BOTtoken+"/sendPhoto HTTP/1.1");
clientTCP.println("Host: " + String(myDomain));
clientTCP.println("Content-Length: " + String(totalLen));
clientTCP.println("Content-Type: multipart/form-data; boundary=Anc");
clientTCP.println();
clientTCP.print(head);
uint8_t *fbBuf = fb->buf;
size_t fbLen = fb->len;
for (size_t n=0;n<fbLen;n=n+1024) {
if (n+1024<fbLen) {
clientTCP.write(fbBuf, 1024);
fbBuf += 1024;
}
else if (fbLen%1024>0) {
size_t remainder = fbLen%1024;
clientTCP.write(fbBuf, remainder);
}
}
clientTCP.print(tail);
esp_camera_fb_return(fb);
int waitTime = 10000; // timeout 10 seconds
long startTimer = millis();
boolean state = false;
while ((startTimer + waitTime) > millis()){
Serial.print(".");
delay(100);
while (clientTCP.available()) {
char c = clientTCP.read();
if (state==true) getBody += String(c);
if (c == '\n') {
if (getAll.length()==0) state=true;
getAll = "";
}
else if (c != '\r')
getAll += String(c);
startTimer = millis();
}
if (getBody.length()>0) break;
}
clientTCP.stop();
Serial.println(getBody);
}
else {
getBody="Connected to api.telegram.org failed.";
Serial.println("Connected to api.telegram.org failed.");
}
return getBody;
}
void setup(){
WRITE_PERI_REG(RTC_CNTL_BROWN_OUT_REG, 0);
// Init Serial Monitor
Serial.begin(115200);
Serial.setDebugOutput(true);
// Set LED Flash as output
pinMode(LED, OUTPUT);
pinMode(PIR, INPUT_PULLUP);
// Config and init the camera
configInitCamera();
// Connect to Wi-Fi
WiFi.mode(WIFI_STA);
Serial.println();
Serial.print("Connecting to ");
Serial.println(ssid);
WiFi.begin(ssid, password);
clientTCP.setCACert(TELEGRAM_CERTIFICATE_ROOT); // Add root certificate for api.telegram.org
while (WiFi.status() != WL_CONNECTED) {
Serial.print(".");
delay(500);
}
Serial.println();
Serial.print("ESP32-CAM IP Address: ");
Serial.println(WiFi.localIP());
startCameraServer();
Serial.print("Camera Ready! Use 'http://");
Serial.print(WiFi.localIP());
local_IP = WiFi.localIP().toString();
Serial.println("' to connect");
Blynk.begin(auth, ssid, password);
}
void motionSensor(){
if(digitalRead(PIR) == LOW){
Serial.println("Send Notification");
Blynk.notify("Motion Detected, Person Is At The Door.");
bot.sendMessage(chat_id, "Motion Detected, Person Is At The Door", "");
Serial.println("alert Sent");
delay(3000);
}
}
void loop() {
Blynk.run();
BLYNK_WRITE(V5);
motionSensor();
if (sendPhoto) {
Serial.println("Preparing photo");
sendPhotoTelegram();
delay(3000);
sendPhoto = false;
}
if (millis() > lastTimeBotRan + botRequestDelay) {
int numNewMessages = bot.getUpdates(bot.last_message_received + 1);
while (numNewMessages) {
Serial.println("got response");
handleNewMessages(numNewMessages);
numNewMessages = bot.getUpdates(bot.last_message_received + 1);
}
lastTimeBotRan = millis();
}
}
The Result
Conclusion
In this IoT home automation and surveillance system project design using Arduino, Blynk and Telegram app. We have successfully, when in the “armed mode”, used the ESP32 Cam and the PIR sensor module to auto-detect and take surveillance pictures of visitors at an entrance door and alert the user of such events on the Telegram app. The user can open a full custom dashboard on the Blynk app, where he can choose to allow the visitor inside by opening the door with his app. Tis app also allows us to control other things like fan speed, lightnings in the house and also display the room temperature and access control to all doors.
What do you think of such DIY design on Home Automation and surveillance? is it worth the effort? Let us know in the comment section below.
In this project, we will measure the direct current (DC) voltage in our power supply using the software and hardware serial connections with the ESP8266-01 and Arduino, as well as monitor it on the Blynk IoT platform. This project is primarily known as “IoT Remote Monitoring Using Blynk.” The following materials are used in this project:
Arduino Unno
ESP8266-01
Blynk Application.
Voltage Sensors
Power Supply(3.3v, 5v, 12v and 23v)
You can buy the complete kit of this tutorial on our online store. If any of the components or kits is not complete, you can chat us and request for it.
What is ESP8266-01?
ESP-01 module and pinout
The ESP8266-01 (ESP-01) is a Wi-Fi module that allows microcontrollers access to a Wi-Fi network. This ESP8266-01 helped in the IoT monitoring of our project. It has 8 pins, which consist of RXD, TXD, GND, VCC, RST, GPIO0, GPIO1, and EN, respectively. In which RXD – is the Receiver, TXD – is the Transmitter. The maximum voltage expected for the ESP8266-01 is 3.3V.
HOW TO CONNECT ESP8266-01 TO ARDUINO UNO.
There are different connections when connecting the Arduino with the ESP8266-01, These are:
Hardware Serial Connection
Software Serial Connection
Hardware Serial Connection
hardware serial connection
This involves connecting the RX and TX of the ESP-01 with the TX and RX of the Arduino Uno respectively.
CONNECTION FORMAT BETWEEN ESP8266-01 AND ARDUINO UNO
ESP 8266 -01
ARDUINO UNO
RX
TX
TX
RX
Hardware serial connection, the schematic view
Software Serial Connection
Software serial connection
This Involves connecting the RX and TX of the ESP-01 to any Digital Pins on the Arduino respectively. For my connection, I will be working with Digital Pin 2 and 3 that is D2 and D3 respectively.
CONNECTION FORMAT BETWEEN ESP8266-01 AND ARDUINO UNO
ESP 8266 -01
ARDUINO UNO
RX
D2
TX
D3
As stated above, on the ESP8266-01 which has 8 pins, The Vcc and EN of ESP-01 is connected to Arduino’s 3.3V. And the RX and TX can be connected using either Hardware Serial connection or Software Serial Connection. And the ESP-01 GND which is connected to the GND of the Arduino. This is a vital step in our IoT remote monitoring project.
How to Measure Power Supply voltage with Arduino
HOW TO CONNECT POWER SUPPLY WITH VOLTAGE SENSOR WITH ARDUINO AND ESP8266-01.
Arduino connected to the voltage sensor module
We can measure the voltage on Our DC Power Supply (3V, 5V, 9V and 12V) using the Voltage Sensor with Arduino Uno and ESP8266-01. The power supply Positive and Negative terminal is connected to the Output of the Voltage Sensor.
The reading of the voltage measure can be shown on the Serial Monitor of the Arduino IDE.
serial monitor print of voltage measured
Then the 3 pins on the Voltage Sensors are connected to the 5V(VCC), GND and an Analog pin 1 (A1) of the Arduino respectively while the ESP8266-01 pins are expected to have a common ground in the Arduino, the Vcc is connected to 3.3V of the Arduino and the RX and TX pins are connected either via Hardware serial connection or Software serial connection.
Arduino with ESP8266-01; The circuit diagram
IOT REMOTE MONITORING OF THE POWER SUPPLY VOLTAGE
In this phase of the project, we will be using the Blynk application.
What is Blynk Application?
Blynk is an IoT platform for iOS or Android smartphones that is used to control Arduino, Raspberry Pi and NodeMCU via the Internet. This application is used to create a graphical interface or human machine interface (HMI) by compiling and providing the appropriate address on the available widgets. We used the Blynk 2.0 version here.
Blynk
Monitoring Power Supply Remotely
For us to display the DC voltage that was measured or displayed from our serial monitor via IoT remote monitoring, we need to sign up for an account with Blynk.
Sign Up on Blynk IoT Platform
Click on start free
Add a new Template on Blynk
Once the sign up is successful and we are inside the dashboard, we locate the template tab and click on “add template”.
click on add template
It will open an input where you can out the name of the project. Select ESP8266 and select WiFi as the connection type.
Configure Your Blynk Template
You can put in the description or just proceed to click done. Once this is done, the template would open up more tabs, this would be the Info, Metadata, DataStreams, Events, Automation, Web Dashboard and Mobile Dashboard. You can also add an image to the template if you so wishes to.
Under the Metadata, we have various infomation about the project as shown below.
However the focus is the Datastreams
we can add a new datastreams which could measure analog, digital, virtual or enumerate as well as tell location.
Next we jump to IoT remote monitoring Web Dashboard and in there we can select and set our widgets that we want to use. Fo r the purpose of this project, we just use the Guage. On the left hand side is the widget selection pane. Alternatively, one can scroll down and select the the widget Guage.
You can enlarge this guage by clicking on the expansion drag and move on the guage. You ca also chage the name from gauge to anything other name you want. Just hover over it, click on the settings that loos like a cog gear on it.
change the name of the widget and select your datastream
Click on the dropdown of datastream and select the project you are working with. After this, click save and leave. You are done with the Web based side. You can then download the Blynk app and set up the mobile version.
Create A Device on Blynk
Click on the search icon and under My Devices, click on New Device. Name your device and connect it to the template. Once this is done, copy the firmware configuration code, and keep it handy.
firmware configuration code
Arduino Code (Arduino Sketch)
// Template ID, Device Name and Auth Token are provided by the Blynk.Cloud
// See the Device Info tab, or Template settings
#define BLYNK_TEMPLATE_ID "TMPLqDo2lSeL"
#define BLYNK_DEVICE_NAME "IoT Solar Panel Monitoring"
#define BLYNK_AUTH_TOKEN "rI2bEfIUnktQRNzO8xg5Ti9swbEWUjhh"
// Comment this out to disable prints and save space
#define BLYNK_PRINT Serial
float PVr1 = 30000.0;
float PVr2 = 7500.0;
float batteryVoltSensor, vinBattery;
const int voltagePinBattery = A1;
#include <ESP8266_Lib.h>
#include <BlynkSimpleShieldEsp8266.h>
char auth[] = BLYNK_AUTH_TOKEN;
// Your WiFi credentials.
// Set password to "" for open networks.
char ssid[] = "AncII";
char pass[] = "helloworld@23";
// Hardware Serial on Mega, Leonardo, Micro...
//#define EspSerial Serial1
// or Software Serial on Uno, Nano...
#include <SoftwareSerial.h>
SoftwareSerial EspSerial(2, 3); // RX, TX
// Your ESP8266 baud rate:
#define ESP8266_BAUD 115200 //9600 //115200
ESP8266 wifi(&EspSerial);
BlynkTimer timer;
// This function sends Arduino's up time every second to Virtual Pin (5).
// In the app, Widget's reading frequency should be set to PUSH. This means
// that you define how often to send data to Blynk App.
void myTimerEvent(){
//now doing calculations
batteryVoltSensor = analogRead(voltagePinBattery);
batteryVoltSensor = (batteryVoltSensor * 5.0)/1023.0;
vinBattery = batteryVoltSensor/(PVr2/(PVr1+PVr2));
Serial.print("DC Measured Voltage : ");
Serial.println(vinBattery);
delay(1000);
Blynk.virtualWrite(V0, vinBattery);
Serial.println(millis() / 1000);
}
void setup()
{
// Debug console
Serial.begin(115200);
// Set ESP8266 baud rate
EspSerial.begin(ESP8266_BAUD);
delay(10);
Blynk.begin(auth, wifi, ssid, pass);
// You can also specify server:
//Blynk.begin(auth, wifi, ssid, pass, "blynk.cloud", 80);
//Blynk.begin(auth, wifi, ssid, pass, IPAddress(192,168,1,100), 8080);
// Setup a function to be called every second
timer.setInterval(1000L, myTimerEvent);
}
void loop(){
Blynk.run();
timer.run(); // Initiates BlynkTimer
}
Results
The IoT Dashboard
Conclusion
We have been able to measure the various voltage levels of power supply ranging from 3.3V to 23V using the voltage sensor module, Arduino with EPS8266-01; and that has given us the capability to display on an IoT remote monitoring dashboard where all the devices and sensors connected can monitored and viewed from anywhere around the globe. Let us know what you think by leaving us a comment in the comment section below. Were you able to recreate the same project following these steps?
In this project, we will measure the direct current (DC) voltage in our power supply using the software and hardware serial connections with the ESP8266-01 and Arduino, as well as monitor it on the Blynk IoT platform. This project is mainly called the IOT (Internet of Things) process. The following materials are used in this project:
Arduino Unno
ESP8266-01
Blynk Application.
Voltage Sensors
Power Supply(3.3v, 5v, 12v and 23v)
You can buy the complete kit of this tutorial on our online store. If any of the components or kits is not complete, you can chat us and request for it.
What is ESP8266-01?
ESP-01 module and pinout
The ESP8266-01 (ESP-01) is a Wi-Fi module that allows microcontrollers access to a Wi-Fi network. This ESP8266-01 helped in the IoT monitoring of our project. It has 8 pins, which consist of RXD, TXD, GND, VCC, RST, GPIO0, GPIO1, and EN, respectively. In which RXD – is the Receiver, TXD – is the Transmitter. The maximum voltage expected for the ESP8266-01 is 3.3V.
HOW TO CONNECT ESP8266-01 TO ARDUINO UNO.
There are different connections when connecting the Arduino with the ESP8266-01, These are:
Hardware Serial Connection
Software Serial Connection
Hardware Serial Connection
hardware serial connection
This involves connecting the RX and TX of the ESP-01 with the TX and RX of the Arduino Uno respectively.
CONNECTION FORMAT BETWEEN ESP8266-01 AND ARDUINO UNO
ESP 8266 -01
ARDUINO UNO
RX
TX
TX
RX
Hardware serial connection, the schematic view
Software Serial Connection
Software serial connection
This Involves connecting the RX and TX of the ESP-01 to any Digital Pins on the Arduino respectively. For my connection, I will be working with Digital Pin 2 and 3 that is D2 and D3 respectively.
CONNECTION FORMAT BETWEEN ESP8266-01 AND ARDUINO UNO
ESP 8266 -01
ARDUINO UNO
RX
D2
TX
D3
As stated above, on the ESP8266-01 which has 8 pins, The Vcc and EN of ESP-01 is connected to Arduino’s 3.3V. And the RX and TX can be connected using either Hardware Serial connection or Software Serial Connection. And the ESP-01 GND which is connected to the GND of the Arduino.
How to Measure Power Supply voltage with Arduino
HOW TO CONNECT POWER SUPPLY WITH VOLTAGE SENSOR WITH ARDUINO AND ESP8266-01.
Arduino connected to the voltage sensor module
We can measure the voltage on Our DC Power Supply (3V, 5V, 9V and 12V) using the Voltage Sensor with Arduino Uno and ESP8266-01. The power supply Positive and Negative terminal is connected to the Output of the Voltage Sensor.
The reading of the voltage measure can be shown on the Serial Monitor of the Arduino IDE.
serial monitor print of voltage measured
Then the 3 pins on the Voltage Sensors are connected to the 5V(VCC), GND and an Analog pin 1 (A1) of the Arduino respectively while the ESP8266-01 pins are expected to have a common ground in the Arduino, the Vcc is connected to 3.3V of the Arduino and the RX and TX pins are connected either via Hardware serial connection or Software serial connection.
Arduino with ESP8266-01; The circuit diagram
IOT MEASURING/MONITORING OF THE POWER SUPPLY VOLTAGE
In this phase of the project, we will be using the Blynk application.
What is Blynk Application?
Blynk is an IoT platform for iOS or Android smartphones that is used to control Arduino, Raspberry Pi and NodeMCU via the Internet. This application is used to create a graphical interface or human machine interface (HMI) by compiling and providing the appropriate address on the available widgets. We used the Blynk 2.0 version here.
Blynk
Monitoring Power Supply Remotely
For us to display the DC voltage that was measured or displayed from our serial monitor via IoT, we need to sign up for an account with Blynk.
Sign Up on Blynk IoT Platform
Click on start free
Add a new Template on Blynk
Once the sign up is successful and we are inside the dashboard, we locate the template tab and click on “add template”.
click on add template
It will open an input where you can out the name of the project. Select ESP8266 and select WiFi as the connection type.
Configure Your Blynk Template
You can put in the description or just proceed to click done. Once this is done, the template would open up more tabs, this would be the Info, Metadata, DataStreams, Events, Automation, Web Dashboard and Mobile Dashboard. You can also add an image to the template if you so wishes to.
Under the Metadata, we have various infomation about the project as shown below.
However the focus is the Datastreams
we can add a new datastreams which could measure analog, digital, virtual or enumerate as well as tell location.
Next we jump to Web Dashboard and in there we can select and set our widgets that we want to use. Fo r the purpose of this project, we just use the Guage. On the left hand side is the widget selection pane. Alternatively, one can scroll down and select the the widget Guage.
You can enlarge this guage by clicking on the expansion drag and move on the guage. You ca also chage the name from gauge to anything other name you want. Just hover over it, click on the settings that loos like a cog gear on it.
change the name of the widget and select your datastream
Click on the dropdown of datastream and select the project you are working with. After this, click save and leave. You are done with the Web based side. You can then download the Blynk app and set up the mobile version.
Create A Device on Blynk
Click on the search icon and under My Devices, click on New Device. Name your device and connect it to the template. Once this is done, copy the firmware configuration code, and keep it handy.
firmware configuration code
Arduino Code (Arduino Sketch)
// Template ID, Device Name and Auth Token are provided by the Blynk.Cloud
// See the Device Info tab, or Template settings
#define BLYNK_TEMPLATE_ID "TMPLqDo2lSeL"
#define BLYNK_DEVICE_NAME "IoT Solar Panel Monitoring"
#define BLYNK_AUTH_TOKEN "rI2bEfIUnktQRNzO8xg5Ti9swbEWUjhh"
// Comment this out to disable prints and save space
#define BLYNK_PRINT Serial
float PVr1 = 30000.0;
float PVr2 = 7500.0;
float batteryVoltSensor, vinBattery;
const int voltagePinBattery = A1;
#include <ESP8266_Lib.h>
#include <BlynkSimpleShieldEsp8266.h>
char auth[] = BLYNK_AUTH_TOKEN;
// Your WiFi credentials.
// Set password to "" for open networks.
char ssid[] = "AncII";
char pass[] = "helloworld@23";
// Hardware Serial on Mega, Leonardo, Micro...
//#define EspSerial Serial1
// or Software Serial on Uno, Nano...
#include <SoftwareSerial.h>
SoftwareSerial EspSerial(2, 3); // RX, TX
// Your ESP8266 baud rate:
#define ESP8266_BAUD 115200 //9600 //115200
ESP8266 wifi(&EspSerial);
BlynkTimer timer;
// This function sends Arduino's up time every second to Virtual Pin (5).
// In the app, Widget's reading frequency should be set to PUSH. This means
// that you define how often to send data to Blynk App.
void myTimerEvent(){
//now doing calculations
batteryVoltSensor = analogRead(voltagePinBattery);
batteryVoltSensor = (batteryVoltSensor * 5.0)/1023.0;
vinBattery = batteryVoltSensor/(PVr2/(PVr1+PVr2));
Serial.print("DC Measured Voltage : ");
Serial.println(vinBattery);
delay(1000);
Blynk.virtualWrite(V0, vinBattery);
Serial.println(millis() / 1000);
}
void setup()
{
// Debug console
Serial.begin(115200);
// Set ESP8266 baud rate
EspSerial.begin(ESP8266_BAUD);
delay(10);
Blynk.begin(auth, wifi, ssid, pass);
// You can also specify server:
//Blynk.begin(auth, wifi, ssid, pass, "blynk.cloud", 80);
//Blynk.begin(auth, wifi, ssid, pass, IPAddress(192,168,1,100), 8080);
// Setup a function to be called every second
timer.setInterval(1000L, myTimerEvent);
}
void loop(){
Blynk.run();
timer.run(); // Initiates BlynkTimer
}
Results
The IoT Dashboard
Conclusion
We have been able to measure the various voltage levels of power supply ranging from 3.3V to 23V using the voltage sensor module, Arduino with EPS8266-01; and that has given us the capability to display on an IoT dashboard that can monitored and viewed from anywhere around the globe. Let us know what you think by leaving us a comment in the comment section below. Were you able to recreate the same project following these steps?