This Project design, IoT Smart Energy BilIing Meter, is the design and construction of an energy meter that is being used to monitor the power consumption of consumers. An IoT dashboard will also be created that will show the amount of power that has been consumed, and a bill will be generated based on the amount of power that has been consumed. The project design uses WiFi connectivity to connect to a network with the Internet and give both the user and the Utility operator access to the energy used.

With this in mind, we will build an Energy meter that can measure:
- Voltage
- Current
- Power
- Energy
- Frequency
And will have a simulation of payment, by assigning some amount of energy units, if the units are exhausted, the meter will turn off the loads until new units are assigned. The meter reading will be sent to an IoT dashboard accessible on the web. You will be able to see the readings and also give some units for the meter.
Components Needed For IoT Smart Energy BilIing Meter Project
| S/N | ITEMS | QUANTITY |
| 1 | RESISTORS 220ohm | 2 |
| 2 | PZEM MODULES | 1 |
| 3 | NODEMCU | 1 |
| 4 | RING TRANSFORMER | 1 |
| 5 | Transfomer RING | 1 |
| 6 | POWER SUPPLY MODULE | 1 |
| 7 | PCB SOCKET BLOCK | 4 |
| 8 | PLASTIC CASING | 1 |
| 9 | VERO BOARD | 1 |
| 10 | CONNECTING WIRES | 3 |
| 11 | PROGRAMMING AND LIBRARIES UPLOAD | 1 |
| 12 | SUPER GLUE | 2 |
| 13 | SOLDERING LEAD | 1 |
| 14 | SOLDERING IRON | 1 |
| 15 | 5V SOLID STATE RELAY | 1 |
| 16 | 5V DC PUMP | 2 |
| 17 | LCD SCREEN | 1 |
| HEADER PIN | 1 | |
| 18 | MISCELLENOUS |
The miscellaneous parts used here are the components like wires, cable-tie, and other peripheral materials you may need to encase and couple the project together.
The Schematic Diagram For The Project Design
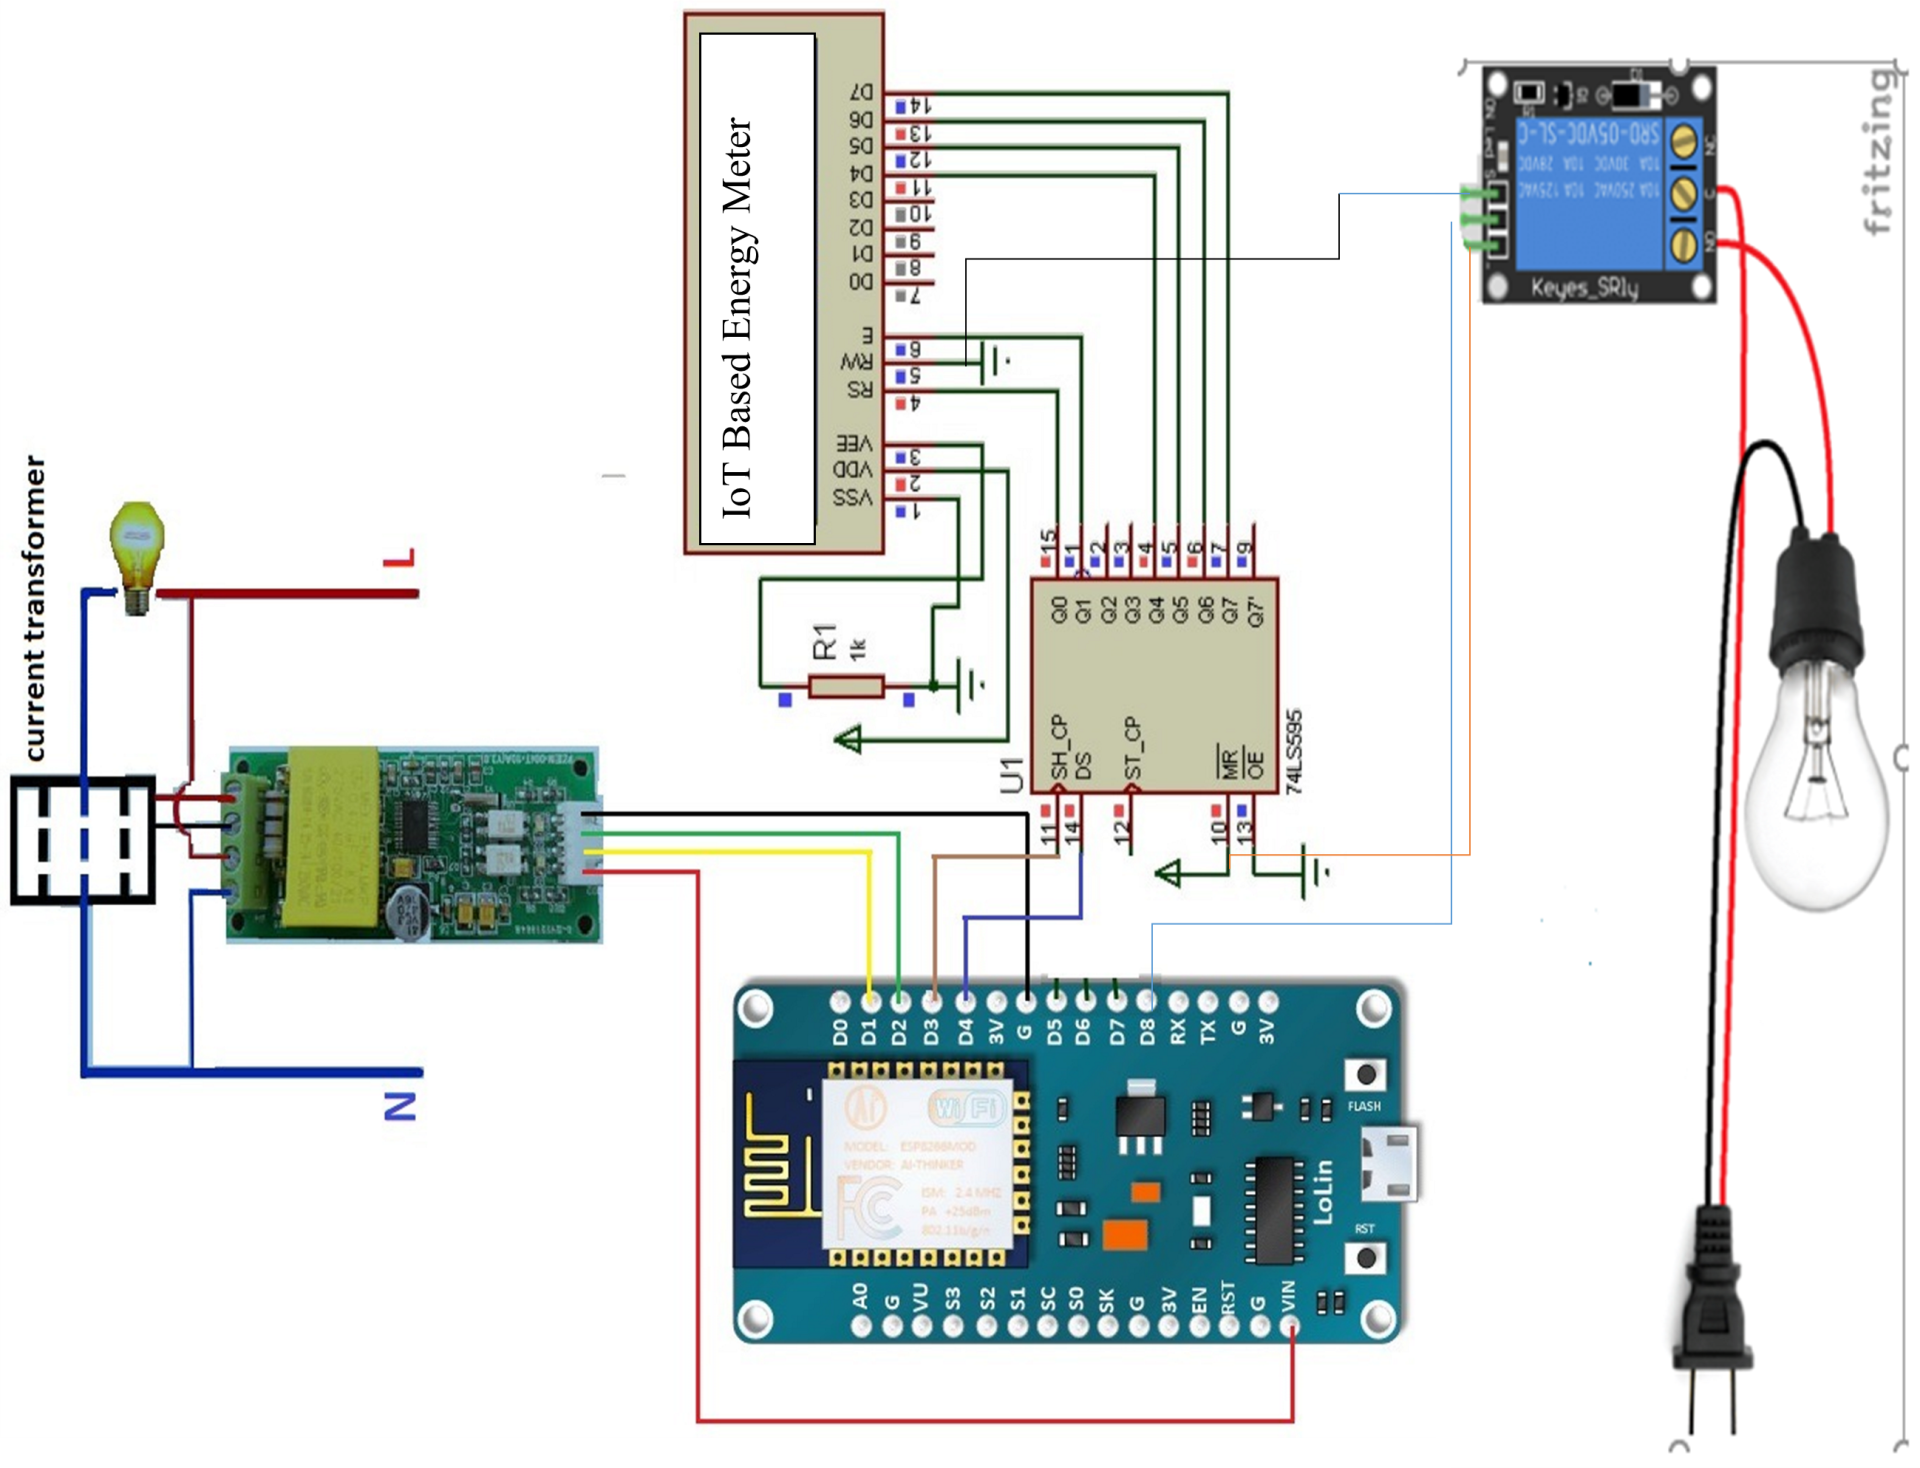
Explanation of the Circuit Diagram
The circuit diagram above shows that the project was built off the NodeMCU board. The NodeMCU board was connected to the PZEM module that is responsible for measuring the Alternating Current (AC) voltage, AC Current, The AC frequency, the power factor etc. We used the GPIO pins D1 and D2 on the NodeMCU board to communicate to the PZEM module via serial communication. The remaining pinout on the PZEM module is connected to the 5V power rails of the power supply.
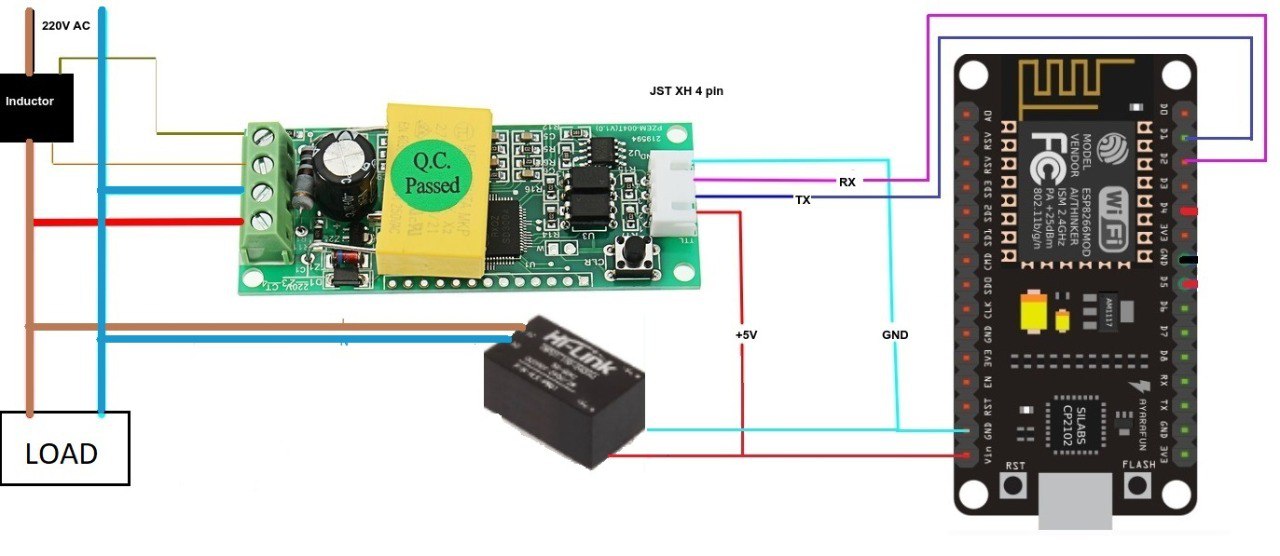
The LCD is connected to the NodeMCU through an I2C module, The choice of LCD used is a 20×4 LCD blue screen module. The circuit design uses a 5V solid state relay to complete the live wire to the AC load connected. Or disengages it to form a break in the AC voltage. This was used to control the AC supply output. The Project performs in such a way that once the PZEM module measure the AC power coming from the input supply, the algorithm does a calculation to know the power consumption the load connected is eating. And using the same algorithm, the unit of electricity is being measured. And if the set quota is exhausted, the relay will be energized and the Live (L) is cut off, hence no more supply to the load.
Designing the Dashboard on Cayenne IoT
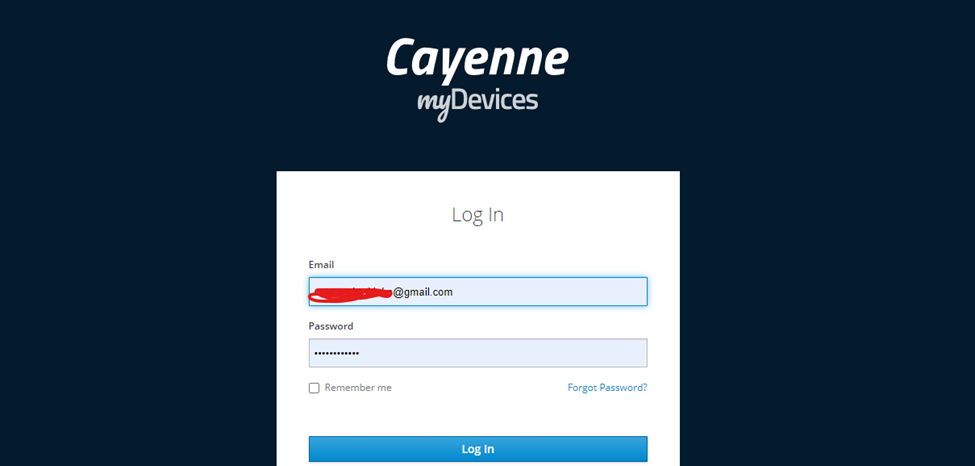
The IoT dashboard used for this project was the Cayenne mydevices server. It was a paid platform for IoT solutions. We logged into this platform and started creating the remote monitoring and control side of this project. After successful creation of an account and logging in; we proceeded to creating the widgets that we needed to display the energy parameters we need for this IoT smart energy billing meter project.
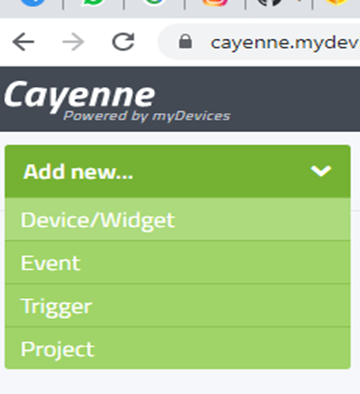
The platform had at the upper left-hand side of it, a navigation dropdown button where the developer can add a new device. For us, this device was our very own NodeMCU. This was selected as ESP8266 as shown in the diagram below.

The widgets also were added the same way. We used the dropdown menu and selected the custom widgets. For the readings on the energy meter to be used for remote view, we used the display chart. This allowed us to display the energy parameter values as shown in the picture diagram below.
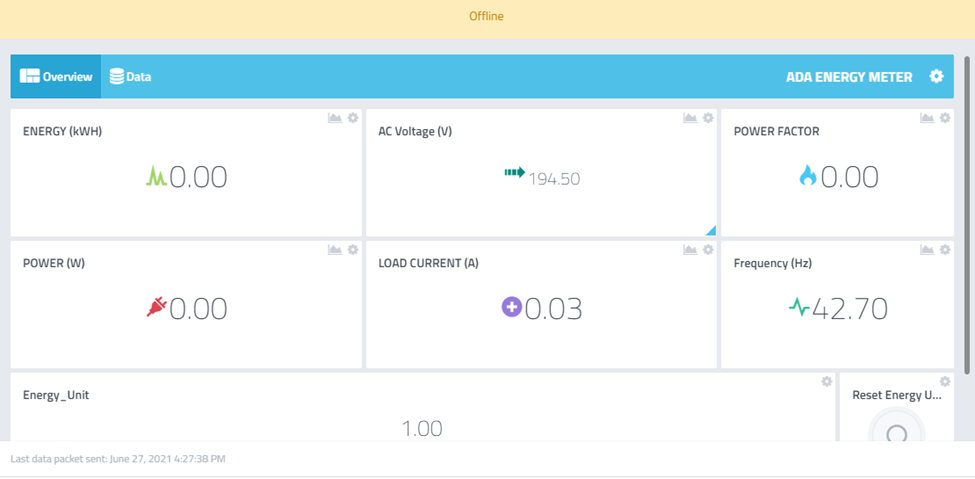
THis is the dashboard after all the widgets are created. We created 7 of such widgets and each have their distinctive function. We used a pushbutton to reset the system for system restoration. This is coded in the program code.
The Source Code For the Project Design
#include <EEPROM.h>
//Lets start by importing the necessary libraries to aid our code.
#include <SoftwareSerial.h> //Import library for using additional UART pins
//include a library to help communicate with the LCD via I2C
#include <LiquidCrystal_I2C.h>
//include a library for the PZEM module. note that it depends on UART in this case we sed a software serial to //define other pins as UART
#include <PZEM004Tv30.h>

//#define CAYENNE_DEBUG
#define CAYENNE_PRINT Serial
#include <CayenneMQTTESP8266.h>

//create and instance of the LiquidCrystal, this name will be use as a class to call all the functions of the lcd library
LiquidCrystal_I2C lcd(0x27, 20, 4);
//create an instance of the PZEM004Tv30 library, this name will be used to call the functions available in the pzem library.
//the pins of the UART is also declared
PZEM004Tv30 pzem(D2, D1); // (RX, TX) OF THE SOFTWARE-SERIAL

//create global variables to hold the values of parameters to be read from the module later in the program
// we declare these variables as float because they will hold floating poin numbers, that is numbers with decimal points
  float voltage;
  float current;
  float power;
  float energy;
  float frequency;
  float pf;

// WiFi network info.
char ssid[] = "XXXXXXXXXX";
char wifiPassword[] = "1234567890";

// Cayenne authentication info. This should be obtained from the Cayenne Dashboard.
char username[] = "00d420d0-cfbe-11eb-8779-7d56e82df461";
char password[] = "b72281be1c7d94c9d604963032cabbd20cedbcbd";
char clientID[] = "XXXXXXXXXXXXXXXXXXXXXXXXX";

unsigned long lastMillis = 0;
const int relay = D5;
float energy_unit = 0.00f;
int reset_state;
bool unit_flag = false;

void setup() {
  EEPROM.begin(512);
  EEPROM.get(1, energy_unit);
  pinMode(relay, OUTPUT);
  digitalWrite(relay, LOW);
  lcd.begin(D3,D4);  // set the 2 required pin for I2C(sda, scl) and initialize the lcd to start operation.
  // Turn on the blacklight and print a message.
  lcd.backlight();//turn on the lcd backlight
  lcd.setCursor(0,0);//set the coordinate for the lcd cursor. this is the point where the lcd start writing.
  lcd.print("Welcome, Miss Ada!");// ouput the text om the lcd screen
  Serial.begin(115200);// initialize UART protocol at a speed of 115200 baud rate.
	Cayenne.begin(username, password, clientID, ssid, wifiPassword);
  lcd.setCursor(0,1);
  lcd.print("Connected to:");
  lcd.setCursor(0,2);
  lcd.print(ssid);
  lcd.setCursor(0,3);
  //lcd.print("Connected to:");
  delay(3000);
  lcd.clear();
}

void loop() {
	Cayenne.loop();
 voltage = pzem.voltage();//request for the voltage reading and store it in out earlier declared volatge
    if( !isnan(voltage) ){//if the reading is  available, display it on cosole
        Serial.print("Voltage: "); Serial.print(voltage); Serial.println("V");
    } else {//if not availabe print an error message as below
        Serial.println("Error reading voltage");
    }
   current = pzem.current();
    if( !isnan(current) ){
        Serial.print("Current: "); Serial.print(current); Serial.println("A");
    } else {
        Serial.println("Error reading current");
    }

    power = pzem.power();
    if( !isnan(power) ){
        Serial.print("Power: "); Serial.print(power); Serial.println("W");
    } else {
        Serial.println("Error reading power");
    }

   energy = pzem.energy();
    if( !isnan(energy) ){
        Serial.print("Energy: "); Serial.print(energy,3); Serial.println("kWh");
    } else {
        Serial.println("Error reading energy");
    }

    frequency = pzem.frequency();
    if( !isnan(frequency) ){
        Serial.print("Frequency: "); Serial.print(frequency, 1); Serial.println("Hz");
    } else {
        Serial.println("Error reading frequency");
    }

    pf = pzem.pf();
    if( !isnan(pf) ){
        Serial.print("PF: "); Serial.println(pf);
    } else {
        Serial.println("Error reading power factor");
    }

    // the following lines tell the MCU to write the measured values on the lcd at designated coordinates
      // the following lines tell the MCU to write the measured values on the lcd at designated coordinates

    lcd.setCursor(0,2);
    lcd.print("Energy:   Volt: Unit:");
    lcd.setCursor(0,3);
    lcd.print(energy,4);
    lcd.print("kWH    ");
    lcd.setCursor(10,3);
    lcd.print(voltage,0);
    lcd.print("v   ");
    lcd.setCursor(16,3);
    lcd.print((energy_unit - energy), 2);
    lcd.print("");


    Serial.println();
    Serial.print("Remaining Energy unit is: ");
    Serial.println(energy_unit - energy);
    Serial.println(reset_state);

    if((energy_unit - energy) <= 0){
    digitalWrite(relay, LOW);
    lcd.setCursor(0,0);
    lcd.print("Out of Energy Quota!");
    lcd.setCursor(0,1);
    lcd.print("Contact Ada for More");
    }
    else{
    digitalWrite(relay, HIGH);
    lcd.setCursor(0,0);
    lcd.print("Power:  P.F:   Curr:");
    lcd.setCursor(0,1);
    lcd.print(power,1);
    lcd.print("W    ");
    lcd.setCursor(8,1);
    lcd.print(pf*100, 1);
    lcd.print("%    ");
    lcd.setCursor(14,1);
    lcd.print(current,3);
    lcd.print("A");
    lcd.print("");
    }
    if (unit_flag == true){
      EEPROM.put(1, energy_unit);
   if (EEPROM.commit()) {
      Serial.print("EEPROM successfully committed: ");
      Serial.println(EEPROM.get(1, energy_unit), 3);
      unit_flag = false;
    } else {
      Serial.println("ERROR! EEPROM commit failed");
    }
    }
    delay(1000);// wait 1 seconds before taking another reading.

}

CAYENNE_IN(8)
{
  int value = getValue.asInt();
  reset_state = value;
  CAYENNE_LOG("Channel %d, value %d", 8, value);
  // Write the value received to the digital pin.
  if(value == 1){
    pzem.resetEnergy();
    //value = 0;
  }
}
// Default function for sending sensor data at intervals to Cayenne.
// You can also use functions for specific channels, e.g CAYENNE_OUT(1) for sending channel 1 data.
CAYENNE_OUT_DEFAULT()
{
	// Write data to Cayenne here. This example just sends the current uptime in milliseconds on virtual channel 0.
	//Cayenne.virtualWrite(0, millis());
  Cayenne.virtualWrite(1, power);
  Cayenne.virtualWrite(2, energy);
  Cayenne.virtualWrite(3, frequency);
  Cayenne.virtualWrite(4, voltage);
  Cayenne.virtualWrite(5, current);
  Cayenne.virtualWrite(6, pf);
  Cayenne.virtualWrite(0, reset_state, TYPE_DIGITAL_SENSOR, UNIT_DIGITAL);
}

// This function is called when data is sent from Cayenne.
CAYENNE_IN(7)
{
  int value = getValue.asInt(); // 0 to 255
  CAYENNE_LOG("Channel %d, pin %d, value %d", 7, relay, value);
  // Write the value received to the PWM pin. analogWrite accepts a value from 0 to 255.
  energy_unit = value/1000.00;
  unit_flag = true;
}
// Default function for processing actuator commands from the Cayenne Dashboard.
// You can also use functions for specific channels, e.g CAYENNE_IN(1) for channel 1 commands.
CAYENNE_IN_DEFAULT()
{
	CAYENNE_LOG("Channel %u, value %s", request.channel, getValue.asString());
	//Process message here. If there is an error set an error message using getValue.setError(), e.g getValue.setError("Error message");
}
Explanation of the Arduino Sketch for IoT Smart Energy BilIing Meter
The program above uses the various libraries needed like the software serial, pzem, lcd and EEPROM libraries at the beginning of the program. We specified where we connected the transmitter and the receiver pins of the PZEM module to the NodeMCU. Also where we connected the I2C lcd adapter to the NodeMCU. We created and defined some floating point variables to hold the different parameters we want to measure.
The setup() function begins some of the modules and begin the cayenne libraries as it tries to connect to the network specified before the setup() function. The rest of the Arduino sketch are explained with comment lines. If you need further explanation, please leave a comment below.
Read More
- IoT Home Automation and Surveillance Project
- IoT Classroom Attendance Surveillance System with ESP32 Cam Arduino
- Arduino Classroom Attendance Counter with ESP32 Cam
- Home Automation Simulation Using Arduino Proteus
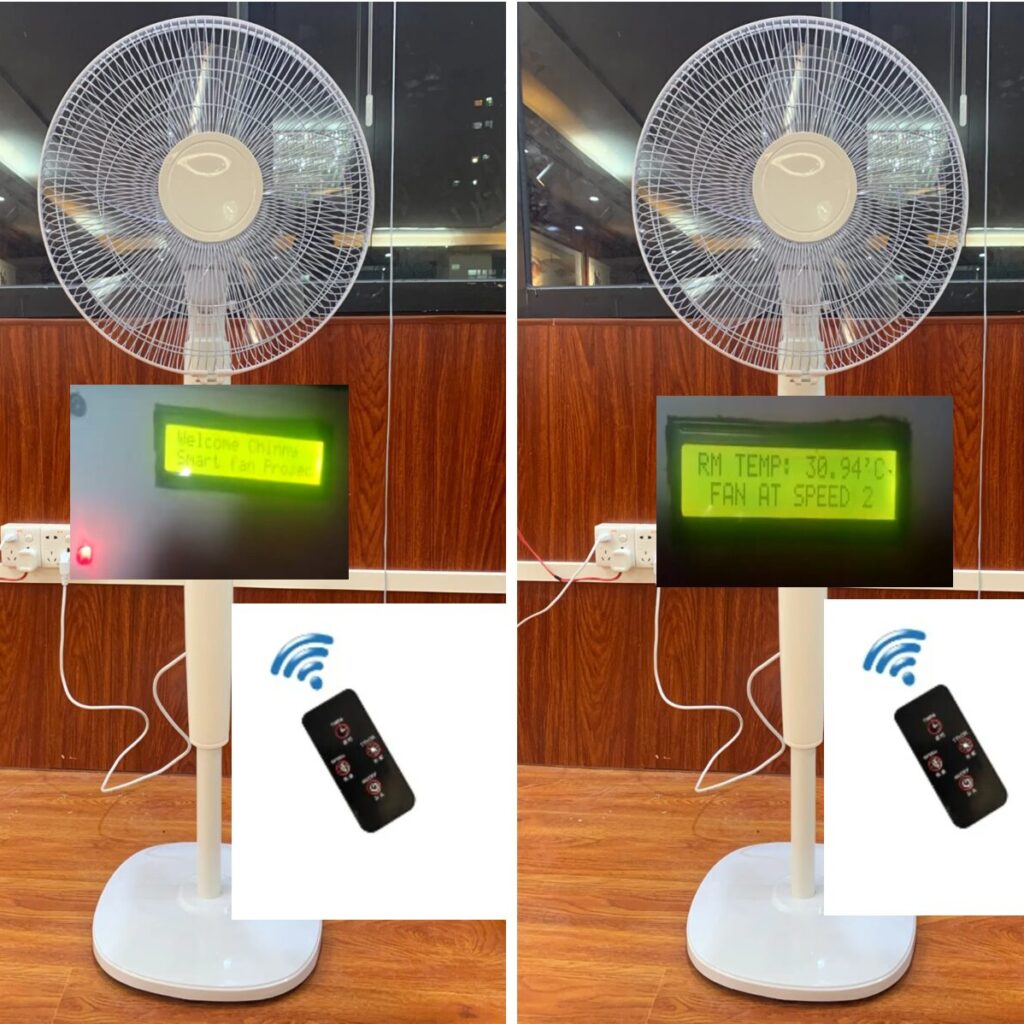
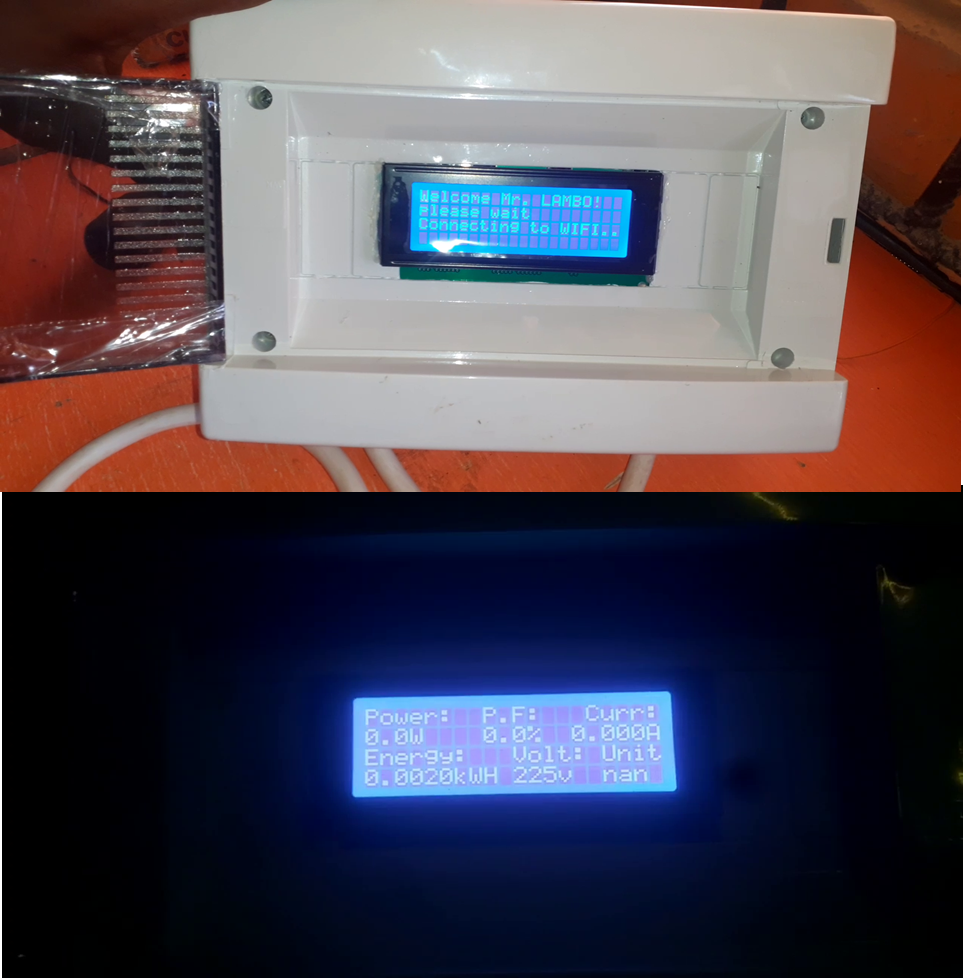
Casing and Assembling the Project Together
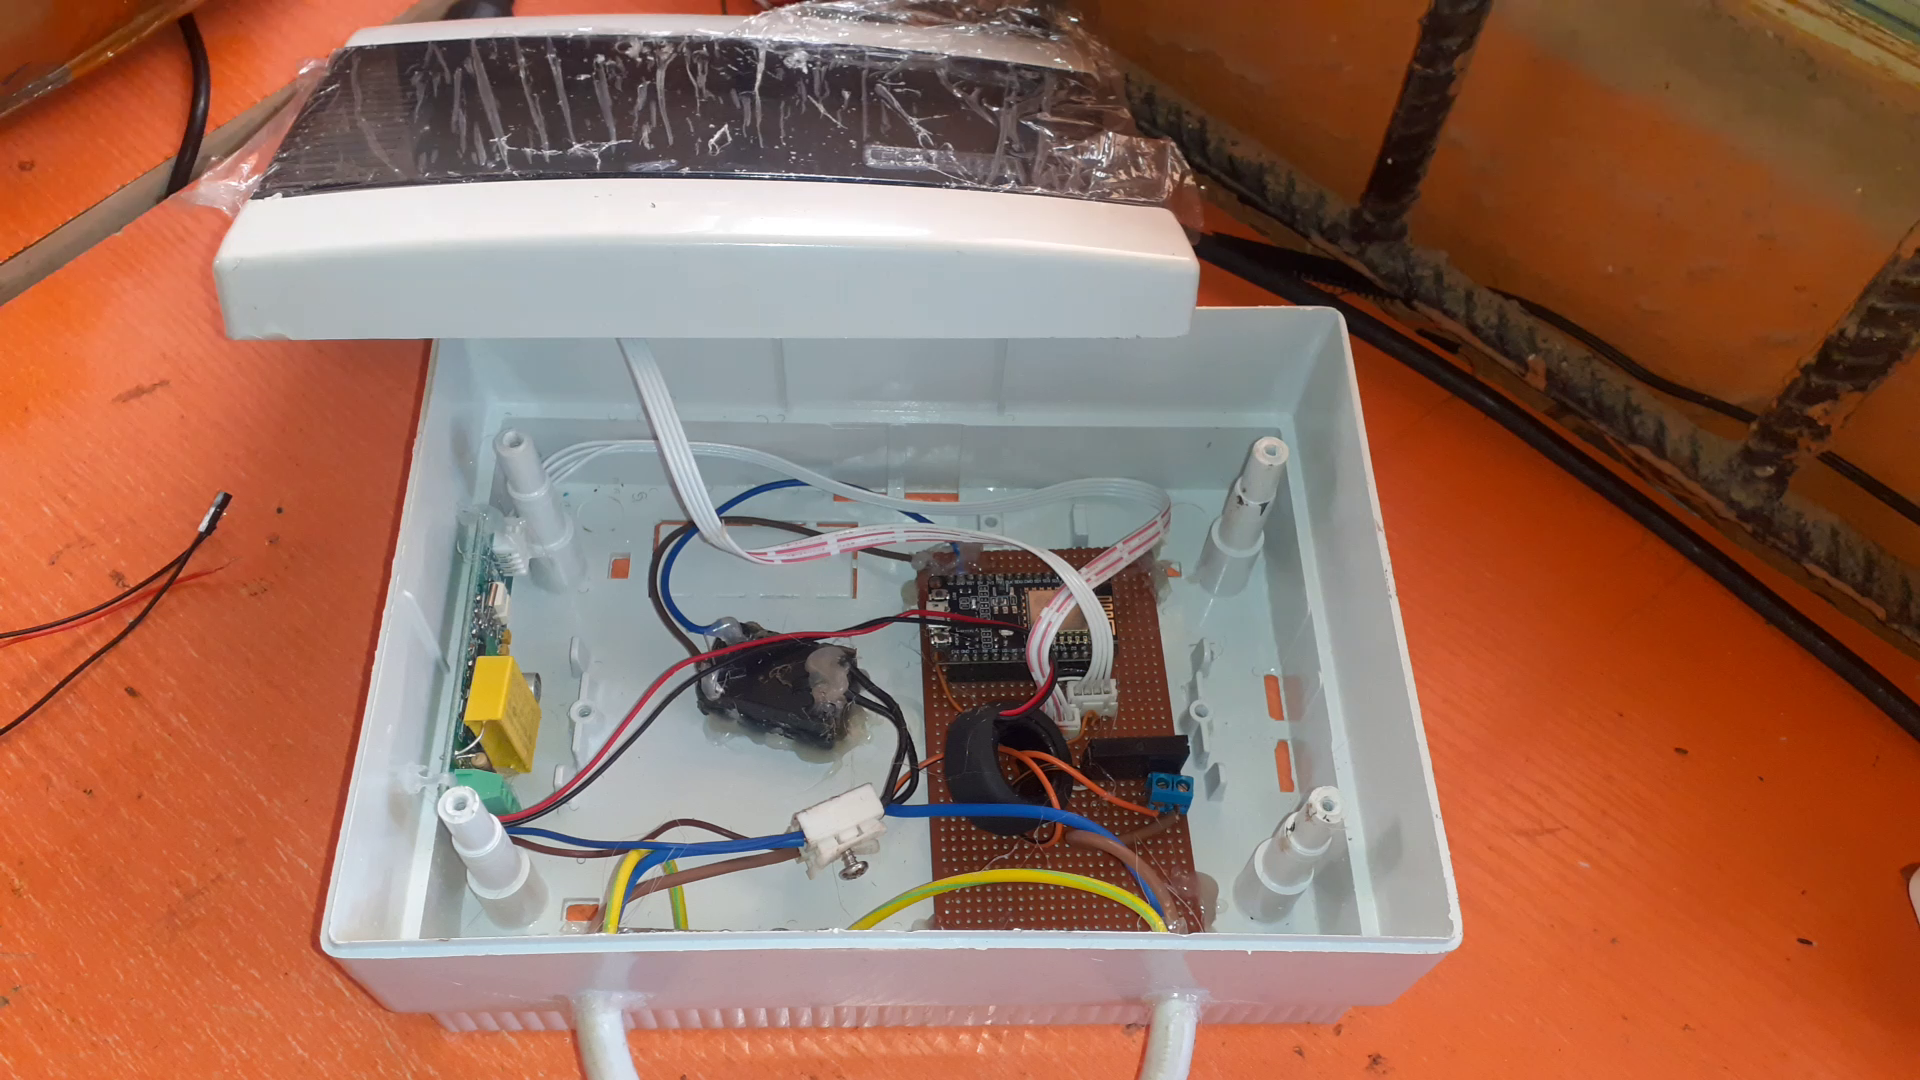
The IoT energy meter was encased inside a 3D case. It has a cover that was transparent and shielded it from rain and dust. And the LCD screen was placed such a way, it could be visible for everyone. The dimension of this case is 8×10”. The transmission cable for the input supply was rated 2.5mm and can carry above 10A AC voltage.
Results and Testing the IoT Smart Energy BilIing Meter
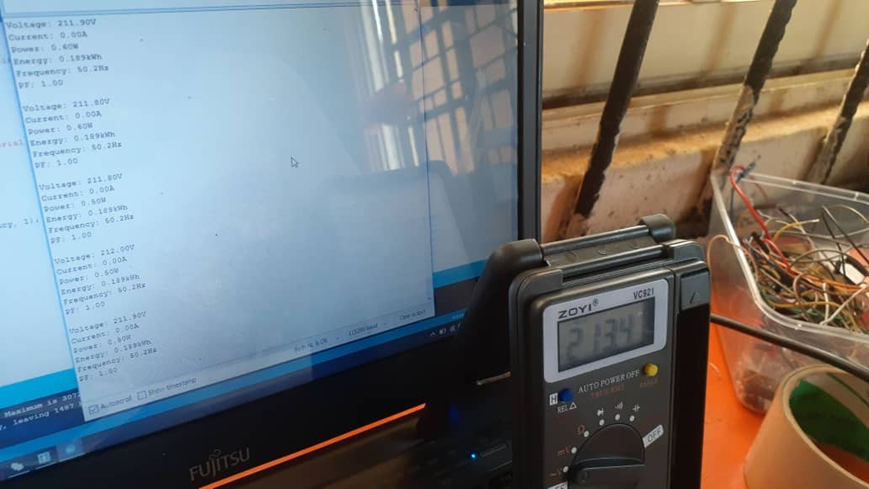
This covers measurement of quantities of voltage, current, power factor, frequency and energy in comparison with an actual meter for test of accuracy.
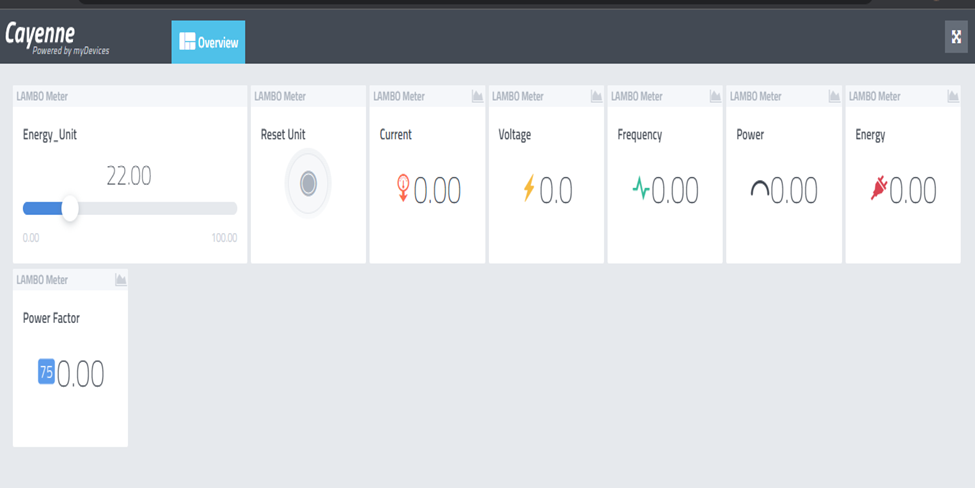
When the system is not connected to the Utility grid or not supplying output to an AC load, we can see on the dashboard on Cayenne IoT mydevices isn’t showing the AC voltage, current, power etc. We can see however, that the energy unit is still in abundance, set at 22.00.
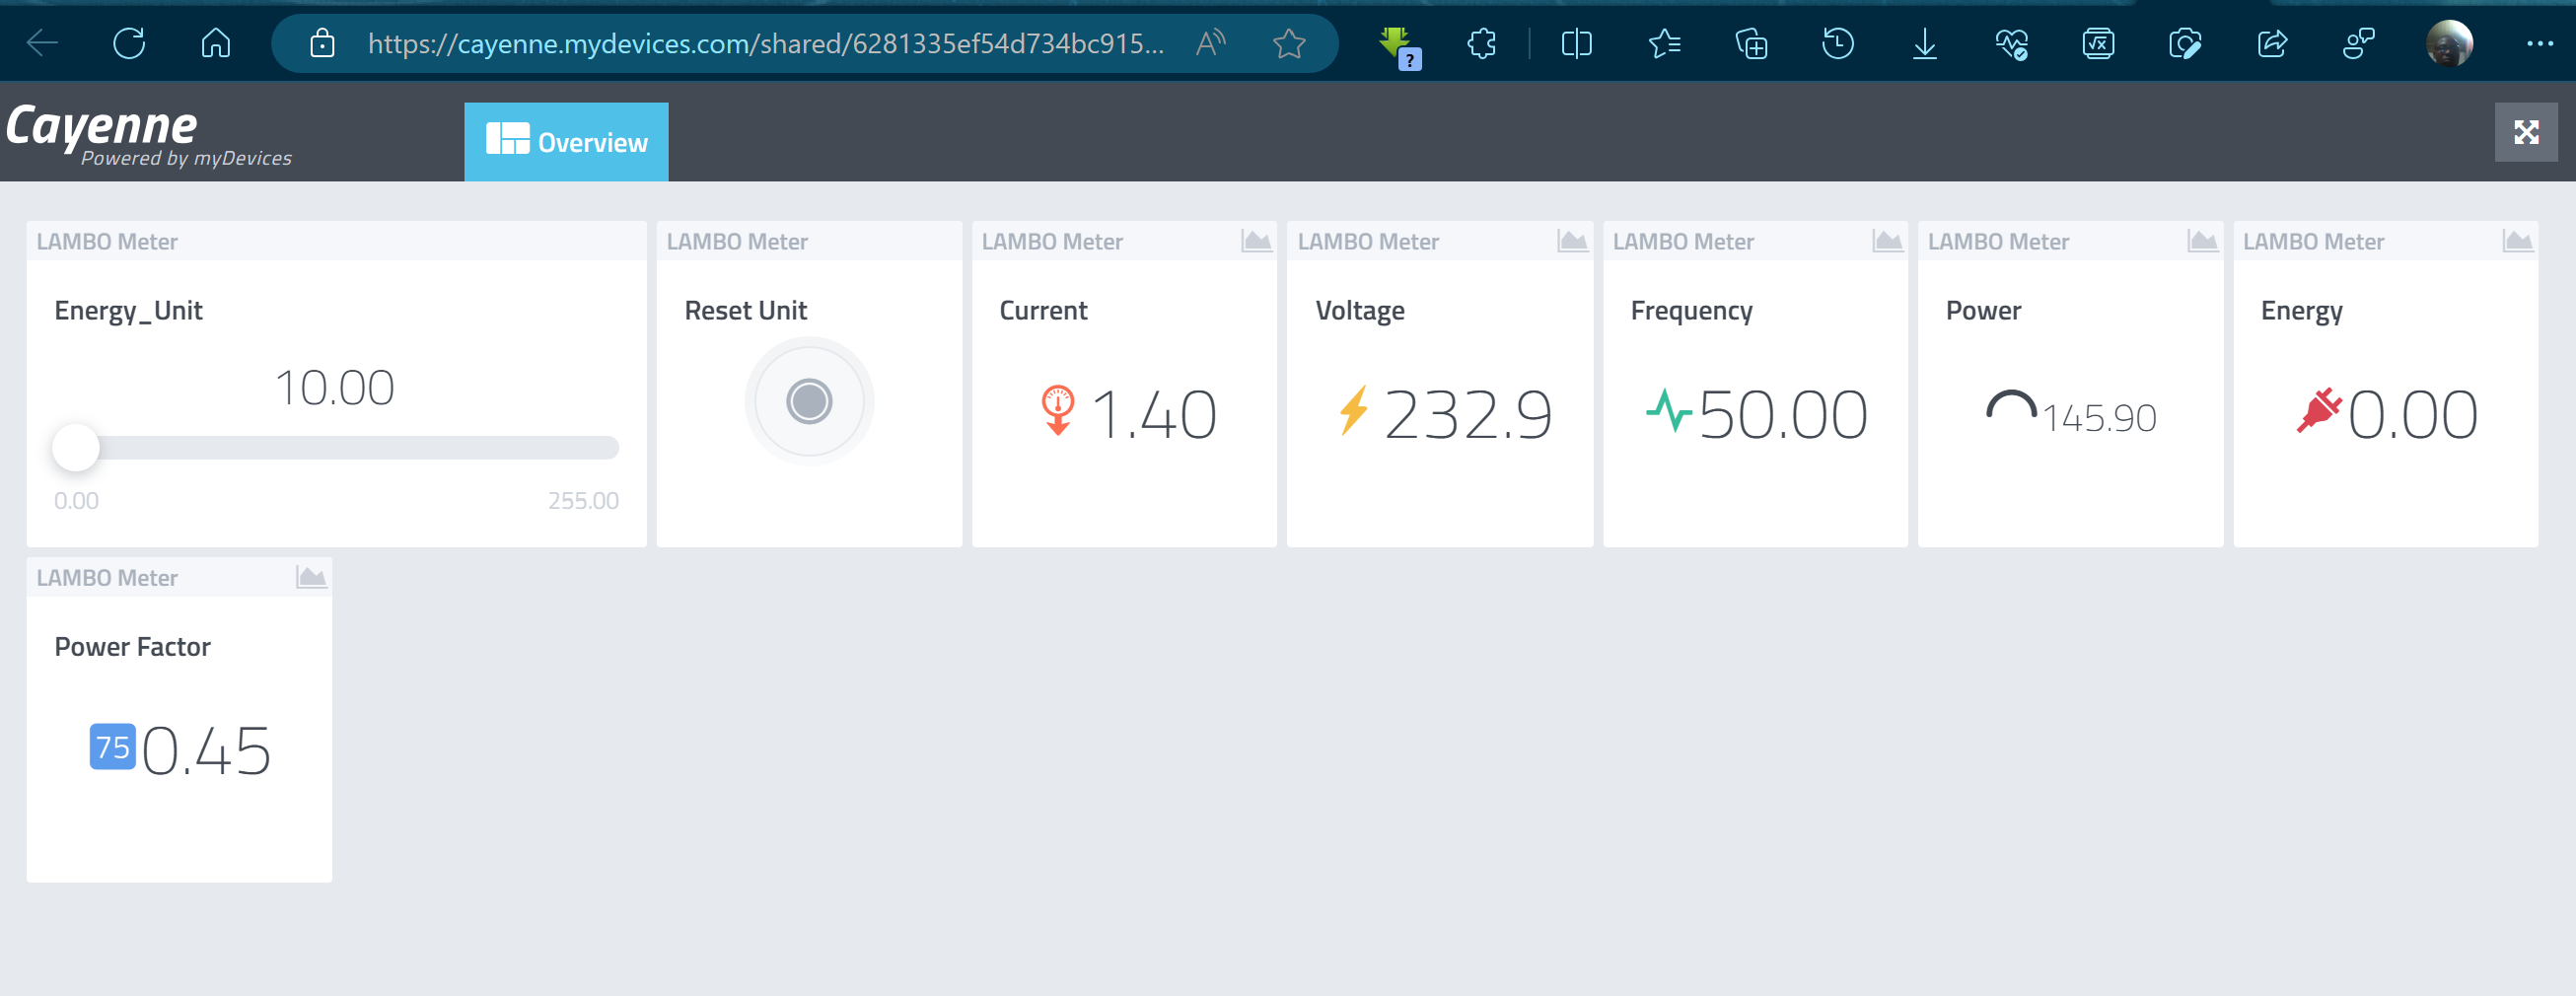
On the other hand, when connected to the Utility grid and a load, we can see the load power consuption, its energy usage, AC voltage, current etc on the IoT dashboard. This test confirms that remote monitoring of the smart meter is possible via connection to a WiFi with internet and logging in to the Cayenne IoT dashboard.
Once the energy quota finishes, the admin can come and add more energy unit to the system by using the slider and after that, he will push the reset unit button. This will update the energy unit in the EEPROM to the set energy quota on the IoT dashboard.
Conclusion
We have designed and constructed an IoT Smart Energy BilIing Meter Project that can measure the energy units used by a connected load, based on an preset energy quota bought, can perfectly time the load to stay powered for the duration of that energy unit. And once it is exhausted, it will turn off the AC load. And the user can pay the admin who will assign a new enrgy unit to the user. The system allows both the user and admin to see the energy metered and billed for transparency sake.