Tag: Arduino

  • Arduino Laser-Based Intrusion Detection System: Anti-Burglar with GSM Control

    Arduino Laser-Based Intrusion Detection System: Anti-Burglar with GSM Control

    In today’s world, security has become a paramount concern for homeowners. With the rise in home automation technologies, protecting your home has never been easier or more innovative. Imagine having a security system so sophisticated that it uses lasers to detect intruders, yet so simple that you can build it yourself using an Arduino and a GSM module. Sounds like something out of a spy movie, right? Well, it’s not. In this guide, we’ll walk you through how to build a laser-powered anti-burglar system that leverages the power of Arduino and GSM technology to keep your home safe. Whether you’re a seasoned DIY enthusiast or a beginner looking to dabble in home automation, this project is perfect for you. Let’s dive in!

    What is a Motion Sensor Based, Laser-Powered Anti-Burglar System?

    Anti-burglar detection system
    Anti-burglar detection system

    At its core, a laser-powered anti-burglar system is a security setup that uses laser beams to create an invisible fence around your home. The idea is simple: laser lights travel in a straight line, and when this line is interrupted—say, by a person or object—the system detects the break and triggers an alarm. The beauty of this system lies in its simplicity and effectiveness.

    It is upgraded up a notched when a motion sensor module, PIR sensors are added to detect human proximity at hours when there supposed to be no one around the vicinity. By integrating it with an Arduino board and a GSM module, we took this project to the next level by enabling remote monitoring and control through the use of calls and SMS commands to activate and deactivate it.

    Read Bimodal Biometric-based Surveillance System

    Components You’ll Need

    Before we get into the nitty-gritty of building the system, let’s talk about the components we used for the project design:

    • Arduino Standalone Uno Board: The brain of the operation, responsible for processing data from the sensors and controlling the system.
    • Laser Torches: These create the laser beams that will act as tripwires.
    • Light Dependent Resistors (LDRs): These sensors detect the presence or absence of laser light.
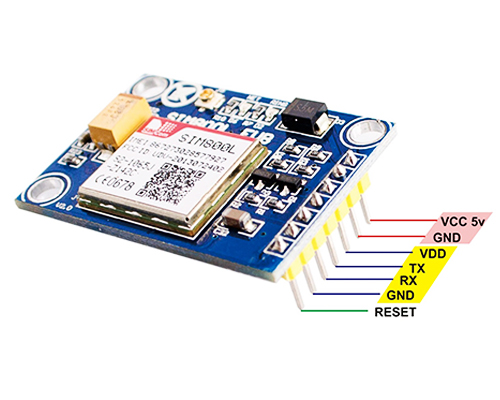
    • SIM800L GSM Module: This module allows the system to send and receive SMS messages for arming, disarming, and alerting the user.
    • Single Channel Relay Module: Used to control the laser torches and other components.
    • Power Supply: We used a 5V power supply module to power the Arduino and all connected components and modules.
    • Wires and Connectors: For connecting everything together.
    • Resistors: To stabilize and manage current in the circuit.
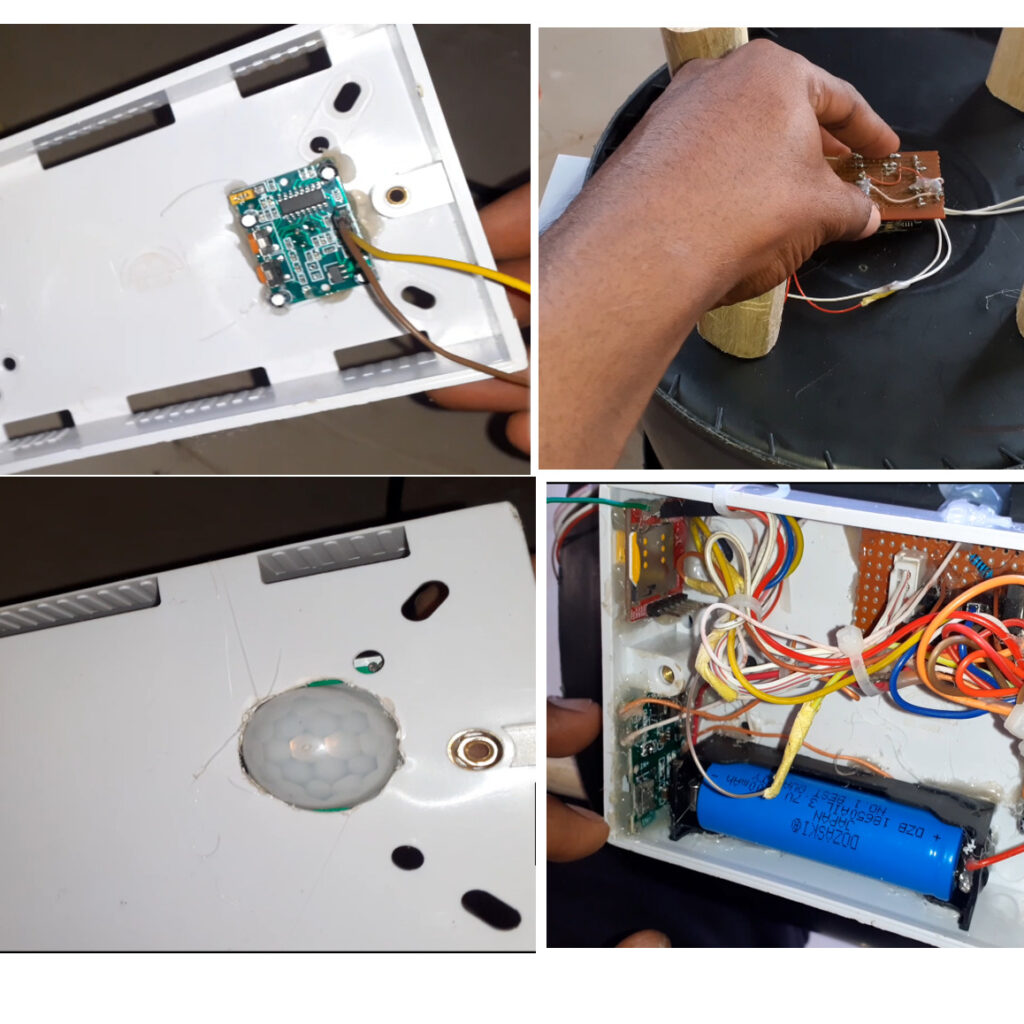
    • PIR Sensor Module: this module is to detect motion of an intruder even when he or she evades the tripwire systems

    How Does the Laser-Powered Anti-Burglar System Work?

    The concept is straightforward. The laser torches are positioned to shine directly onto LDRs, creating an invisible barrier around the perimeter of your model home. As long as the laser light is uninterrupted, the LDRs will register a high level of brightness, and the Arduino will record this as a safe state. However, if someone or something blocks any of the laser beams, the LDRs will detect a drop in brightness, signaling the Arduino that the system has been tripped.

    The house model for the Motion sensor based, laser-powered anti-burglary detection system
    The house model for the project design

    Also, if the burglar was able to maneuver the tripwire and didn’t interrupt any of the laser torch on each sides, the PIR motion sensor would be trigger of such motion when this happens. This is where the GSM module comes into play. Once the system detects a breach, the Arduino sends a signal to the GSM module, which then sends an SMS alert to the designated phone numbers, informing them of the intrusion. Also an alarm goes off that deters the burglary act further. Additionally, the system can be armed or disarmed remotely via SMS or phone call, making it incredibly versatile and user-friendly.

    Step-by-Step Guide to Building the System

    How the anti-burglar system works
    How the anti-burglar system works

    Now that you understand the basic concept, let’s break down the steps to build this laser-powered anti-burglar system.

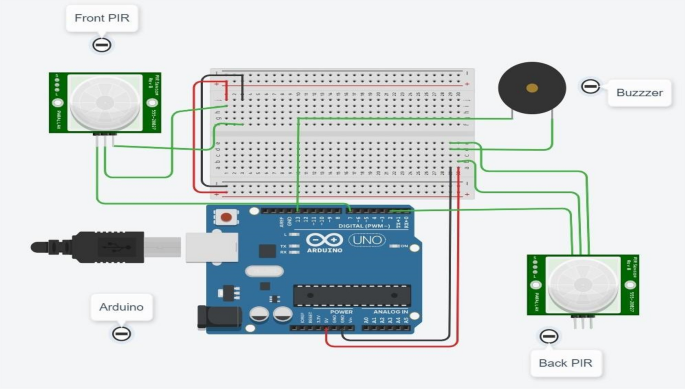
    The Schematic Diagram of the Laser-Powered Anti-Burglar Detection System Design

    schematic diagram of the Laser-Powered Anti-Burglar System
    schematic diagram of the Laser-Powered Anti-Burglar System

    The schematic diagram is shown above, you can view the bread board version below.

    Step 1: Setting Up the Arduino and GSM Module

    Schematic diagram of the Anti-burglary system design
    Schematic diagram of the Anti-burglary system design

    We began by setting up our Arduino Uno standalone board. We connected the SIM800L GSM module to the Arduino standalone board using the software serial communication. The GSM module will be responsible for sending and receiving both call and SMS commands. We made sure to insert a SIM card into the module and connect it to the Arduino using jumper wires.

    Read also The Women’s Suffrage Movement.

    • VCC to 5V (Arduino)
    • GND to GND (Arduino)
    • TX to Pin D11 (Arduino Rx)
    • RX to Pin D12 (Arduino Tx)

    This setup allows the Arduino to communicate with the GSM module, enabling remote control capabilities.

    Step 2: Configuring the Laser and LDR Sensors

    The Four LDR sensors and four lasers used for the tripwire system
    The Four LDR sensors and four lasers used for the tripwire system

    Next, we positioned the laser torches and LDRs around our model home. The lasers should be set up so that their beams shine directly onto the LDRs. Each LDR will need to be connected to the Arduino to monitor the light intensity on the Light dependent resistors (LDRs).

    • We connected the LDRs to the analog pins (A0, A1, A2, A3 and A4) on the Arduino standalone board.
    • On the other end of the LDR was connected to a resistor of 10k ohms and then to GND.

    This configuration ensures that the LDRs are correctly positioned to detect any interruption in the laser beams.

    Step 3: Calibrating for Day and Night Conditions

    One of the unique features of this system is its ability to work both during the day and at night. To achieve this, we needed to calibrate the LDRs for different light conditions. During the day, ambient light might affect the LDR readings, so we used an additional LDR to monitor the overall light level.

    • We placed the ambient light LDR in an area that receives consistent daylight. That is at the rooftop of the home model.
    • We used this reading from this LDR to adjust the sensitivity of the corner LDRs.

    This ensures that the system remains effective regardless of the time of day.

    Image on WordPress Post Not Showing on Frontend – Image Error Solved

    Writing the Arduino Code

    The heart of this project is the Arduino code, which ties all the components together. The code will:

    • Monitor the LDRs for changes in light intensity.
    • Trigger the alarm and send an SMS alert via the GSM module if an interruption is detected.
    • Trigger the alarm and send SMS alert via the GSM module if the motion sensors are activated.
    • Allow remote arming and disarming of the system via SMS and phone call.
    #include <SoftwareSerial.h>
    #include <EEPROM.h>
    
    // Configure software serial port
    SoftwareSerial mySerial(11, 12);
    
    String CellNumtemp, textMessage;
    String CellNum;
    String admin1 = "+2347062174135";
    
    boolean Armed = EEPROM.read(0);
    char checkStatus;  //
    
    int pirPin1 = 5;
    int pirPin2 = 6;
    
    
    int ldrRoofPin = A5;
    int ldrFrontPin = A1;
    int ldrleftPin = A2;
    int ldrRightPin = A3;
    int ldrBackPin = A0;
    
    // Output Pins
    int laserActivePin = A4;
    int AlarmPin = 7;
    
    int ldrTopSense, ldrBackSense, ldrLeftSense, ldrRightSense, ldrFrontSense;
    
    int pirRead, pir2Read;
    
    // Variables will change:
    int ledState = LOW;
    unsigned long previousMillis = 0;  // will store last time LED was updated
    
    // constants won't change:
    const long interval = 1000;
    
    boolean night, day;
    
    String number = "+2348114180467";  //-> change with your number
    String showMessage;
    char mode = 'r';
    
    String message1 = "Command Received. System Armed";
    String message2 = "Command Received. System Disarmed";
    String message3 = "Command Received, System is ";
    String message4 = "Alert!!, Alert!!! System is Breached! ";
    String message5 = "Alert!!, Alert!!! System Motion is triggered! ";
    String message6 = "I am sorry but you don't have admin power hence you can't make such commands. Thank you. ";
    
    String systemStatus = "";
    
    String nullMessage = "is UNSUCCESSFUL";
    
    void setup() {
      //tell MCU ur outputs
      pinMode(laserActivePin, OUTPUT);
      pinMode(AlarmPin, OUTPUT);
    
      //tell MCU ur inputs
      pinMode(pirPin1, INPUT);
      pinMode(pirPin2, INPUT);
    
    
      //off Alarm
      digitalWrite(AlarmPin, LOW);
      // Open serial communications and wait for port to open:
      Serial.begin(9600);
      while (!Serial) {
        ;  // wait for serial port to connect. Needed for native USB port only
      }
      Serial.println("Serial begin ok");
    
      // set the data rate for the SoftwareSerial port
      mySerial.begin(9600);
      mySerial.println("AT");
      delay(10);
    
      disarmSensors();
    }
    
    int readLdrSensors() {
      ldrTopSense = analogRead(ldrRoofPin);
      ldrLeftSense = analogRead(ldrleftPin);
      ldrRightSense = analogRead(ldrRightPin);
      ldrFrontSense = analogRead(ldrFrontPin);
      ldrBackSense = analogRead(ldrBackPin);
    
      return ldrLeftSense, ldrRightSense, ldrFrontSense, ldrTopSense, ldrBackSense;
    }
    
    bool nightAndDay() {
      readLdrSensors();
      if (ldrTopSense <= 500) {
        day = true;
        night = false;
      } else if (ldrTopSense >= 500) {
        day = false;
        night = true;
      }
      return night, day;
    }
    
    
    bool checkMotion() {
      for (int i = 0; i < 25; i++) {
        int pirRead = digitalRead(pirPin1);
        //Serial.println(pirRead);
        if (pirRead == 1) {
          return true;
        } else {
          return false;
        }
      }
      delay(500);
    }
    
    
    bool checkMotion2() {
      for (int i = 0; i < 25; i++) {
        int pir2Read = digitalRead(pirPin2);
        //Serial.println(pirRead);
        if (pir2Read == 1) {
          return true;
        } else {
          return false;
        }
      }
      delay(500);
    }
    
    
    int armSensors() {
      Serial.println("\nArmed");
      Armed = 1;
      EEPROM.update(0, Armed);
      return Armed;
    }
    
    int disarmSensors() {
      Serial.println("\nSensors Disarmed");
      analogWrite(laserActivePin, 0);
      digitalWrite(AlarmPin, LOW);
      Serial.println("LASER OFF");
      Armed = 0;
      EEPROM.update(0, Armed);
      return Armed;
    }
    
    char burglarDetect() {
      armSensors();
      readLdrSensors();
      nightAndDay();
    
      if ((night == true) && (day == false)) {
        analogWrite(laserActivePin, 255);
        digitalWrite(AlarmPin, LOW);
        Serial.println("LASER ON");
    
        if ((checkMotion2() == true) || (checkMotion() == true) || (ldrBackSense <= 500) || (ldrFrontSense <= 500) || (ldrLeftSense <= 500) || (ldrRightSense <= 500)) {
          digitalWrite(AlarmPin, HIGH);
          checkStatus = 'd';
          Serial.println("Sensors triggered at night!");
        }
      }
    
      else if ((night == false) && (day == true)) {
        analogWrite(laserActivePin, 0);
        digitalWrite(AlarmPin, LOW);
        Serial.println("LASER OFF");
        digitalWrite(AlarmPin, LOW);
        if ((checkMotion2() == true) || (checkMotion() == true)) {
          digitalWrite(AlarmPin, HIGH);
          checkStatus = 'e';
          Serial.println("Motion Sensors triggered!");
        }
      }
    
      else {
        Serial.println("Quite as the grave");
      }
     
      Serial.print("pir 1: ");
      Serial.print(checkMotion());
      Serial.print(" Pir 2: ");
      Serial.println(checkMotion2());  //
      Serial.println("Night: " + String(night) + " Day " + String(day));
      Serial.println("Top: " + String(ldrTopSense) + " left: " + String(ldrLeftSense) + " Right: " + String(ldrRightSense) + " Back: " + String(ldrBackSense));
      delay(500);
       return checkStatus;
    }
    
    void loop() {
            //burglarDetect();
      unsigned long currentMillis = millis();
       if (currentMillis - previousMillis >= interval) {
             previousMillis = currentMillis;
         if (ledState == LOW) {
           ledState = HIGH;
            checkIncomingSMS();
         }
         else {
           ledState = LOW;
               SendMessage();
         }
       }
    }
    
    // check if there are incoming SMS
    String checkIncomingSMS() {
      // AT command to set mySerial to SMS mode
      mySerial.print("AT+CMGF=1\r");
      delay(100);
      // Read the first SMS saved in the sim
      mySerial.print("AT+CMGR=1\r");
      delay(10);
      // Set module to send SMS data to serial out upon receipt
      mySerial.print("AT+CNMI=2,2,0,0,0\r");
      delay(100);
      if (mySerial.available() > 0) {
        textMessage = mySerial.readString();
        //save the phone number of the senders in a string (country code)
        CellNumtemp = textMessage.substring(textMessage.indexOf("+234"));
        CellNum = CellNumtemp.substring(0, 14);
        Serial.print(" phone ");
        Serial.print(CellNum);
        Serial.print(" ");
        Serial.println(textMessage);
        delay(10);
            if(CellNum == admin1){
        if (textMessage.indexOf("Arm") >= 0) {
          burglarDetect();
          checkStatus = 'a';
        }
    
        if (textMessage.indexOf("Disarm") >= 0) {
          disarmSensors();
          checkStatus = 'b';
        }
    
        if (textMessage.indexOf("Status") >= 0) {
          checkStatus = 'c';
        }
      }
            else if(CellNum != admin1){
              if ((textMessage.indexOf("Status") >= 0) || (textMessage.indexOf("Disarm") >= 0) || (textMessage.indexOf("Arm") >= 0)){
              checkStatus = 'f';
            }
            }
      }
      CellNumtemp = "";
      textMessage = "";
      mySerial.print("AT+CMGD=1\r");
      mySerial.print("AT+CMGD=2\r");
      return CellNum;
    }
    
    
    void dummy() {
      mySerial.println("AT+CMGF=1");  //Sets the GSM Module in Text Mode
      delay(200);
      mySerial.println("AT+CMGS=\"" + CellNum + "\"\r");  //Mobile phone number to send message
      delay(200);
    }
    
    void SendMessage() {
      Serial.print("Got phone: ");
      Serial.println(CellNum);
      Serial.println(" Arm State: " + String(Armed));
      if (Armed == 1) {
        systemStatus = "ACTIVE";
        burglarDetect();
      } 
      else if (Armed == 0) {
        systemStatus = "OFF";
      }
      switch (checkStatus) {
        case 'a':
          dummy();
          mySerial.println("Hello," + message1);
          break;
        case 'b':
          dummy();
          mySerial.println("Hello," + message2);
          break;
        case 'c':
          dummy();
          mySerial.println("Hello," + message3 + systemStatus);
          break;
        case 'd':
          dummy();
          mySerial.println("Alert!," + message4);
          break;
        case 'e':
          dummy();
          mySerial.println("Alert!," + message5);
          break;
        case 'f':
          mySerial.println("Hello," + message6);
          break;
      }
      updateSerial();
      delay(100);
      mySerial.println((char)26);  // ASCII code of CTRL+Z
      delay(200);
      checkStatus = 'z';
    }
    
    void updateSerial() {
      delay(5);
      while (Serial.available()) {
        mySerial.write(Serial.read());  //Forward what Serial received to Software Serial Port
      }
      while (mySerial.available()) {
        Serial.write(mySerial.read());  //Forward what Software Serial received to Serial Port
      }
    }


    Read also Flirt Like a Pro: Mastering the Art of Body Language

    Explanation of the Arduino Code (SMS Command only)

    This Arduino code is designed for a laser-powered anti-burglar system that utilizes various sensors, such as PIR (Passive Infrared) sensors and LDRs (Light Dependent Resistors), to detect motion and light levels. The system includes GSM functionality for remote control and alerts via SMS. The code starts by configuring the necessary pins for inputs and outputs, initializes serial communication, and reads stored settings from EEPROM to determine whether the system is armed or disarmed upon startup.

    In the setup function, the system initializes the serial ports, sets pin modes for the sensors and outputs, and disarms the sensors by default. The loop function periodically checks for incoming SMS messages and determines whether to arm, disarm, or check the status of the system based on commands sent via SMS. The code includes functions to handle the reading of light and motion sensors, enabling the system to differentiate between day and night, and activate or deactivate the laser and alarm accordingly.

    When the system is armed, the burglarDetect function continuously monitors the sensors. If it detects motion or a significant change in light levels, it triggers the alarm and sends an alert message. The system’s response varies based on whether it is day or night, using different sensors to determine if a breach has occurred. SMS commands are processed in the checkIncomingSMS function, which verifies the sender’s number and executes the corresponding action, either arming, disarming, or reporting the system’s status.

    Finally, the SendMessage function sends SMS responses based on the current status of the system and any detected breaches. The code includes safeguards to prevent unauthorized users from controlling the system, ensuring that only predefined admin numbers can arm or disarm the system. The use of EEPROM ensures that the system remembers its armed state even after a power cycle. Overall, the code provides a robust framework for a remote-controlled, sensor-based security system.

    Testing the System

    Before we finalized our setup, we began to test the system to ensure everything works as expected. We simulated an intrusion by interrupting one of the laser beams and observe whether the LDRs detect the change and trigger the alarm. Also, by triggering the motion sensors too placed at the various blind spot positions. This evidently worked as we programmed it as shown in the YouTube video above. We equally tested the SMS functionality by arming and disarming the system remotely.

    See also 5 Weird Facts About the World’s Smallest Organism: Tardigrades

    Fine-Tuning and Adjustments

    To get the code for both the SMS and Call commands, you can send us a message here on WhatsApp. We will be delighted to forward it to you. Alternatively, you can head over to the GitHub repo to download a free version of it. However, talk with us can enhance your chances of using the project and perhaps getting some of your questions answered.

    Once the basic setup is working, you can fine-tune the system. Adjust the threshold values for the LDRs to optimize performance, and ensure the laser beams are accurately aligned with the sensors. You might also consider adding additional features, such as a siren or integration with other home automation systems.

    Advantages of a Laser-Powered Anti-Burglar System

    There are several reasons why a laser-powered anti-burglar system is an excellent choice for home security:

    • Precision: Lasers provide a high level of accuracy in detecting intrusions, reducing false alarms.
    • Cost-Effective: The components needed for this system are affordable, making it accessible for DIY enthusiasts.
    • Scalability: You can easily expand the system by adding more laser torches and LDRs to cover a larger area.
    • Remote Monitoring: The integration of a GSM module allows you to monitor and control the system remotely, providing peace of mind when you’re away from home.

    Potential Challenges and How to Overcome Them

    While the system is effective, there are a few challenges you might encounter:

    • Alignment Issues: Proper alignment of the lasers and LDRs is crucial for the system’s success. Take your time during the setup to ensure everything is perfectly aligned.
    • Interference: Ambient light, especially sunlight, can interfere with the LDR readings. Calibrating the system for day and night conditions can mitigate this issue.
    • Power Supply: Ensure that your power supply is stable and sufficient to run all components, especially if you’re adding more sensors or features.

    Expanding the System: What’s Next?

    Once you’ve mastered the basic setup, you can explore expanding the system with additional features:

    • Siren Integration: Add a loud siren to deter intruders once the system is tripped.
    • Wireless Communication: Incorporate wireless communication modules like Bluetooth or Wi-Fi to extend the system’s capabilities.
    • Camera Integration: Pair the system with a camera module to capture images or videos of the intrusion for evidence.

    Conclusion

    Building a laser-powered anti-burglar system with Arduino and GSM control is not just a fun and educational project—it’s a practical solution for home security. By following the steps outlined in this guide, you can create a robust security system that’s both cost-effective and easy to manage. Whether you’re looking to secure your home, a model house, or just want to experiment with Arduino projects, this system offers a versatile and scalable solution. So, why wait? Start building your own laser-powered security system today!

    Frequently Asked Questions (FAQs)

    1. Can I use this system in a real house, or is it just for models? Yes, while this project is designed for a model house, you can scale it up for real-world use by using more powerful lasers and placing the LDRs strategically around your property.

    2. What happens if someone tampers with the system? If someone tries to tamper with the system by cutting the power or blocking the lasers, the Arduino can be programmed to send an immediate alert via SMS, allowing you to take action.

    3. How reliable is the SMS communication? The reliability of SMS communication depends on the GSM module and the network signal strength in your area. Ensure that your SIM card has sufficient balance and that the GSM module is in a location with good signal reception.

    4. Can I add more laser beams to cover a larger area? Absolutely! You can add more laser torches and LDRs to cover additional entry points or a larger perimeter. Just make sure to adjust the Arduino code to accommodate the extra sensors.

    5. How do I power the system? The system can be powered using a standard 9V battery or an external power supply. If you’re adding more components, consider using a more robust power source to ensure stability.

  • IoT Health Monitoring with LoRa, ESP32 Arduino for Real-Time Tracking

    IoT Health Monitoring with LoRa, ESP32 Arduino for Real-Time Tracking

    This IoT health monitoring with LoRa technology project design that uses ESP32 board to read a DHT11 sensor for human temperature and skin humidity. It also reads the pulse rate of the person. using a pulse sensor module. The ESP32 is connected to a LoRa module, Sx1278, so that it can form a transmitter side. This will send the values of the parameters read to another design, the receiver side that has Arduino Nano board and another LoRa module connected to it; with an LCD that will display the values received. The ESP32 board also is programmed to to search for a WiFi network with internet access and send the values of the pulse rate, body temperature and skin humidity measured to a thingspeak platform.

    In the rapidly evolving world of IoT (Internet of Things), remote health monitoring systems have become increasingly important. This project leverages the power of the ESP32, LoRa modules, and the ThingSpeak platform to create a system that can monitor temperature, humidity, and pulse rate. The data is transmitted wirelessly to a remote receiver and is also uploaded to an online platform for easy access and monitoring.

    Introduction

    IoT health monitoring with LoRa technology
    IoT health monitoring with LoRa technology

    The integration of IoT in healthcare has paved the way for innovative solutions that can monitor patient health remotely. This project focuses on creating a system that reads body temperature, body humidity, and pulse rate using an ESP32, pulse rate sensor and DHT11 sensor. The data is transmitted via LoRa to a remote receiver, which displays the readings on an LCD. Additionally, the ESP32 is programmed to connect to WiFi and send the data to ThingSpeak, allowing for real-time monitoring over the internet

    Components/Modules Need For the IoT Pulse Rate Monitoring Project

    ITEM DESCRIPTIONQUANTITY
    LiPo CHARGING MODULE1
    LCD Module1
    3×6 INCH PATRESS BOX1
    Connector3
    RESISTORS2
    CONNECTING WIRES3 yards
    DHT11 Sensor1
    ECG SENSOR1
    LIPO BATTERY1
    SOLDER1
    SOLDERING IRON1
    Buzzer1
    ARDUINO NANO BOARD1
    ESP32 Dev BOARD11
    BUZZER1
    LCD MODULE1
    PULSE/HEART RATE SENSOR1
    OLED MODULE1
    FEMALE HEADERPIN2
    MISCELLANEOUS 

    Understanding the Components

    IoT Pulse Rate Monitoring: The ESP32 board and pulse rate monitor sensor module
    The ESP32 board and pulse rate monitor sensor module

    The ESP32 is a strong microcontroller that is developed by Expressif company in China; and it is a great option for Internet of Things projects because it has integrated WiFi and Bluetooth capabilities. It is appropriate for battery-operated devices since it has several GPIO pins, supports a range of communication protocols, and has a low power usage mode.

    While the pulse sensor detects changes in light absorption in blood vessels to measure heart rate, it is a common component of wearable health devices and is easily integrated into this ESP32 project. On the other hand, the DHT11 sensor is a low-cost digital sensor for measuring temperature and humidity. It provides a calibrated digital output and is easy to interface with any microcontroller. Hence our choice for it to read the user’s body temperature and skin humidity.

    IoT Health Monitoring with LoRa technology project
    IoT Health Monitoring with LoRa technology project

    For this IoT Health Monitoring with LoRa technology project, we needed to transmit the readings of the sensors from the user to a qualified personnel, say perhaps a doctor or a health professional wirelessly without having to incur the cost of data via internet. For such long-distance wireless communication, LoRa (Long Range) modules are utilized. They are renowned for their low power consumption and long-range data transmission capabilities (up to 10 km in open regions), and they operate in the unlicensed ISM bands.

    The receiver side of this project uses an Arduino Nano , this board is a compact version of the Arduino Uno and is often used in projects where space is limited. It has fewer GPIO pins than the Uno but is more than sufficient for this project.

    The LCD display will be used to show the temperature, humidity, and pulse rate values received by the Arduino Nano. The module was the 16×4 version and it worked very well for us to display all the parameters we received. , depending on the user’s preference.

    The Schematic Diagram for the IoT Pulse Rate Monitoring

    The transmitter side of the IoT Pulse monitoring project
    The transmitter side of the IoT Pulse monitoring project

    Explanation of the Schematic Diagram

    The IoT pulse and humidity monitoring project with LoRa technology schematic diagram
    The IoT pulse and humidity monitoring project with LoRa technology schematic diagram

    The schematic diagram showed that the IoT Health Monitoring with LoRa technology project design for the transmitter was built around the ESP32 Development (dev) board. The ESP32 is powered by the output of the LiPo battery charging module. Which in turn was powered by the 3.3V LiPo battery. The type of circuitry found in the module made it very easy for us to get an output of 5V by regulating the onboard potentiometer on the module.

    This 5V logic is then paralleled across the sensors that used 5V as their input logic voltage. This is the digital humidity and temperature sensor (DHT11) and the pulse/heart rate sensor module. The ESP32 has an onboard regulator that can output 3.3V and this is connected to the LoRa module since it can only support 3.3V logic voltage for its operation. All the Ground (GND) pins are connected together to ensure the system works as expected. The 0.96 inch OLED (organic light emitting diode) consumes 5V and can still work on 3.3V but we connected it to the 5V power rail to ensure optimum performance.

    Connection of the LoRa Module

    The circuit diagram for IoT Health Monitoring with LoRa technology project
    The circuit diagram for IoT Health Monitoring with LoRa technology project

    The connection of the LoRa module was done using the Serial Peripheral Interface (SPI). The LoRa module has for SPI pins. The MISO (master in, slave out) which was connected to GPIO (general purpose input output) 19 on the ESP32 dev board, MOSI (Master out, slave in) which was connected to GPIO pin 22 on the ESP32, SCK (serial clock) is connected GPIO 18. tHe Input output (IO) 0 on the LoRa module is connected to the GPIO pin 2 on the ESP32, whereas, the reset pin of the LoRa module is connected to the ESP32 GPIO pin 14.

    Explanation for DHT11 Sensor Connection

    How the DHT11 sensor was connected in the schematic diagram
    How the DHT11 sensor was connected in the schematic diagram

    The ESP32 dev board read the dht11 connected to its GPIO pin 21, the digital input pin of the DHT11 that is. The power rails of the DHT11 sensor is connected to the 5V logic. For the DHT11 to work precisely, a 10kΩ precision resistor is added by connected it between the Vcc and the GND pins respectively.

    The Arduino Nano Board (Receiver Side)

    connection of the Nano board with the LoRa module
    connection of the Nano board with the LoRa module

    Since the connection needed an SPI protocol, the SPI buses on the Arduino Nano were used as shown in the schematic diagram above. Once these connections were ensured, the program code below was uploaded into the Arduino Nano to receive data from the transmitter side of the project.

    connection of the Nano board with the LoRa module
    connection of the Nano board with the LoRa module

    The both systems are running on rechargeable power option. The type of power modules used in the transmitter and the receiver side allowed us to charge the 3.3V LiPo battery and get 5V output to power and run each system effectively.

    Programming the Project Design

    Arduino Program Code for the ESP32 (Transmitter Side)

    #include <WiFi.h>
    #include "ThingSpeak.h"
    #include <SPI.h>
    #include <LoRa.h>
    #include "DHT.h"
    //
    #include <Wire.h>
    #include <Adafruit_GFX.h>
    #include <Adafruit_SSD1306.h>
    //
    #define SCREEN_WIDTH 128 // OLED display width, in pixels
    #define SCREEN_HEIGHT 64 // OLED display height, in pixels
    
    // Declaration for an SSD1306 display connected to I2C (SDA, SCL pins)
    Adafruit_SSD1306 display(SCREEN_WIDTH, SCREEN_HEIGHT, &Wire, -1);
    
    
    const char* ssid = "Galaxy A51 917E";   // your network SSID (name) 
    const char* password = "ancsucre21";   // your network password
    //set the instance for High BP and Low BP
    #define HBPpin 13
    #define LBPpin 27
    
    WiFiClient  client;
    
    unsigned long myChannelNumber = 1;
    const char * myWriteAPIKey = "MTL2US26KL1BFUT1";
    // Timer variables
    unsigned long lastTime = 0;
    unsigned long timerDelay = 10000;
    
    //define where the heart rate sensor is connected
    #define sensorPinout 12
    int sensorPin;
    // Digital pin connected to the DHT sensor
    #define DHTPIN 4
    //define where the buzzer is connected
    #define buzzerPin 15
    
    int counter = 0;
    bool panic;
    float h, t, f;
    int sensorAnalog,heartRate, checkHBP, checkLBP = 0; 
    String greeting = "hello";
    
    //define the pins used by the transceiver module
    #define ss 5
    #define rst 14
    #define dio0 2
     // DHT 11
    #define DHTTYPE DHT11
    // as the current DHT reading algorithm adjusts itself to work on faster procs.
    DHT dht(DHTPIN, DHTTYPE);
    
    void loraSetup(){
      while (!Serial);
      Serial.println("LoRa Sender");
    
      //setup LoRa transceiver module
      LoRa.setPins(ss, rst, dio0);
      
      //replace the LoRa.begin(---E-) argument with your location's frequency 
      //433E6 for Africa & Asia
      //866E6 for Europe
      //915E6 for North America
      while (!LoRa.begin(433E6)) {
        Serial.println(".");
        delay(500);
      }
       // Change sync word (0xF3) to match the receiver
      // The sync word assures you don't get LoRa messages from other LoRa transceivers
      // ranges from 0-0xFF
      LoRa.setSyncWord(0xF3);
      Serial.println("LoRa Initializing OK!");
    }
    
    void thingspeakSetup(){
      WiFi.mode(WIFI_STA);     
      ThingSpeak.begin(client);  // Initialize ThingSpeak
    // Connect or reconnect to WiFi
        if(WiFi.status() != WL_CONNECTED){
          Serial.print("Attempting to connect");
          while(WiFi.status() != WL_CONNECTED){
            WiFi.begin(ssid, password); 
            delay(5000);     
          } 
          Serial.println("nConnected.");
        }   
    }
    
    void setup() {
    //initialize Serial Monitor
      Serial.begin(115200);
    //begin the dht sensor
     dht.begin();
    //start the thingspeak setup
    thingspeakSetup();
    //start the LoRa setup
    loraSetup();
    //set ur inputs and outouts make the buzzer an output
    pinMode(buzzerPin, OUTPUT);
    pinMode(HBPpin, INPUT_PULLUP);
    pinMode(LBPpin, INPUT_PULLUP);
    //check for display
    if(!display.begin(SSD1306_SWITCHCAPVCC, 0x3C)) { // Address 0x3D for 128x64
        Serial.println(F("SSD1306 allocation failed"));
        for(;;);
      }
      delay(2000);
      display.clearDisplay();
    
      display.setTextSize(1);
      display.setTextColor(WHITE);
      // Display static text at column 10 row 0
      display.setCursor(0, 10);
      display.println("  WELCOME SOPHIA");
      display.setCursor(0, 20);
      display.println("  LoRa & IoT BASED ");
      display.setCursor(0, 30);
      display.println(" PROJECT ");
      display.display(); 
    }
    
    int heartRateReader(){
      sensorPin = analogRead(sensorPinout);                 // wait for a second
      //  delay(500);
      return sensorPin;
    }
    
    float dhtSensor(){
      // Reading temperature or humidity takes about 250 milliseconds!
      // Sensor readings may also be up to 2 seconds 'old' (its a very slow sensor)
       h = dht.readHumidity();
      // Read temperature as Celsius (the default)
       t = dht.readTemperature();
      // Read temperature as Fahrenheit (isFahrenheit = true)
       f = dht.readTemperature(true);
    return h, t, f;
      // Check if any reads failed and exit early (to try again).
      if (isnan(h) || isnan(t) || isnan(f)) {
        Serial.println(F("Failed to read from DHT sensor!"));
      }
    
      // Compute heat index in Fahrenheit (the default)
      float hif = dht.computeHeatIndex(f, h);
      // Compute heat index in Celsius (isFahreheit = false)
      float hic = dht.computeHeatIndex(t, h, false);
    }
    
    int checkHeartCondition(){
     checkHBP = digitalRead(HBPpin);
     checkLBP = digitalRead(LBPpin);
     return checkHBP, checkLBP;
    }
    
    void panicDisplay(){
      display.clearDisplay();
        display.setTextColor(SSD1306_WHITE);        // Draw white text
     display.setCursor(0, 5);
     //display.setTextSize(2);
     display.setTextSize(1);
     display.print("Abnorma Levels Detected. nContact a Medical Expert Soon ");
     display.display(); 
    }
    
    int raiseAlarm(){
      checkHeartCondition();
      dhtSensor();
    
       if(sensorPin == 0){
        sensorPin = 60;
        digitalWrite(buzzerPin, LOW);
        panic = false;
      }
    
      if(checkHBP == LOW){
        sensorPin = 240;
        digitalWrite(buzzerPin, HIGH);
        //panicDisplay();
        panic = true;
      }
    
      if(checkLBP == LOW){
        sensorPin = 0;
        digitalWrite(buzzerPin, HIGH);
        //panicDisplay();
        //panic = true;
      }
        
      //check if the alrm should sound
      if((h >= 100.00) || (t >= 50.00)){
        digitalWrite(buzzerPin, HIGH);
        //panicDisplay();
        panic = true;
      }
    
      else{
        sensorPin /= 2;
        panic = false;
      }
    
      return panic, sensorPin;
    }
    
    void oledDisplay(){
      raiseAlarm();
      
      if(panic != true){
        display.clearDisplay();
        display.setTextColor(SSD1306_WHITE);        // Draw white text
    
     display.setCursor(0, 5);
     display.setTextSize(1);
     display.print("H.R: ");
     display.setTextSize(2);
     //display.setCursor(5, 5);
     display.print(sensorPin);
      display.setTextSize(1);
      display.print(" bpm");
      
      
      display.setCursor(0, 25);
      display.setTextSize(1);
     display.print("B.H: ");
     display.setTextSize(2);
      display.print(h);
      display.setTextSize(1);
      display.print(" %");
      
      display.setCursor(0, 45);
      display.setTextSize(1);
     display.print("B.T: ");
     display.setTextSize(2);
      display.print(t);
      display.setTextSize(1);
      display.print("'C");
        
       display.display(); 
      }
     
      else IF (panic == true){
        display.clearDisplay();
        display.setTextColor(SSD1306_WHITE);        // Draw white text
        display.setTextSize(1);
        display.print("SOMETHING IS WRONG nPLEASE SEE A DOCTORnSOON!!!");
        display.display();
    
      }
    }
    
    void sendTruLoRa(){
      Serial.println("<<<Sending packet>>>");
      Serial.print("hum: ");Serial.print(h);
      Serial.print(" temp: "); Serial.print(t);
      Serial.print(" heart rate: "); 
      Serial.println(sensorPin);
    
      //Send LoRa packet to receiver
      LoRa.beginPacket();
      //use delimiters
      LoRa.print('<');
      LoRa.print(greeting); LoRa.print(',');
      LoRa.print(h);LoRa.print(',');
      LoRa.print(t);LoRa.print(',');
      LoRa.print(sensorPin);LoRa.print('>');
      LoRa.endPacket();
    
    }
    
    
    void sendToThingspeak(){
     raiseAlarm();
      oledDisplay();
      
      if ((millis() - lastTime) > timerDelay) {
    // pieces of information in a channel.  Here, we write to field 1.
        int x = ThingSpeak.writeField(myChannelNumber, 1, sensorPin, myWriteAPIKey);
        int y = ThingSpeak.writeField(myChannelNumber, 2, h, myWriteAPIKey);
        int z = ThingSpeak.writeField(myChannelNumber, 3, t, myWriteAPIKey);
        //uncomment if you want to get temperature in Fahrenheit
        //int x = ThingSpeak.writeField(myChannelNumber, 1, temperatureF, myWriteAPIKey);
    
        if(x == 200){
          Serial.println("Channel update successful.");
        }
        else{
          Serial.println("Problem updating channel. HTTP error code " + String(x));
        }
        lastTime = millis();    
        }
     delay(1000);
    //raiseAlarm();
    //oledDisplay();
    sendTruLoRa();  
    }
    
    void loop() {
      //heartRateReader();
      
     sendToThingspeak();
     delay(200); 
    }


    Given the condition that no test patient would be allowed to go into cardiac arrest for this project, two push buttons were used as shown above to simulate these conditions physically. The push buttons when depressed acted as going into a high pulse rate and low pulse rate. The program code allowed us to read the states of the pushbuttons.

    The code above when uploaded and the serial monitor opened. The results show the received data from the transmitter end. And each count that was sent for each burst of transmitted data.

    Arduino Program Code for the Arduino Nano board (Receiver Side)

    #include <SPI.h>
    #include <LoRa.h>
    
    //define the pins used by the transceiver module
    #define ss 5
    #define rst 14
    #define dio0 2
    
    void setup() {
      //initialize Serial Monitor
      Serial.begin(115200);
      while (!Serial);
      Serial.println("LoRa Receiver");
    
      //setup LoRa transceiver module
      LoRa.setPins(ss, rst, dio0);
      
      //replace the LoRa.begin(---E-) argument with your location's frequency 
      //433E6 for Asia
      //866E6 for Europe
      //915E6 for North America
      while (!LoRa.begin(866E6)) {
        Serial.println(".");
        delay(500);
      }
       // Change sync word (0xF3) to match the receiver
      // The sync word assures you don't get LoRa messages from other LoRa transceivers
      // ranges from 0-0xFF
      LoRa.setSyncWord(0xF3);
      Serial.println("LoRa Initializing OK!");
    }
    
    void loop() {
      // try to parse packet
      int packetSize = LoRa.parsePacket();
      if (packetSize) {
        // received a packet
        Serial.print("Received packet '");
    
        // read packet
        while (LoRa.available()) {
          String LoRaData = LoRa.readString();
          Serial.print(LoRaData); 
        }
    
        // print RSSI of packet
        Serial.print("' with RSSI ");
        Serial.println(LoRa.packetRssi());
      }
    }


    The LCD (liquid crystal display) module was connected using the 4-bit communication protocol that means that only 4 wires were needed for the writing of data from the Nano board to the LCD module. The Register Select (RS) and the Enable (E) was connected to the  A2 and A1 respectively while the data pins D4 through D7 was connected to A0, A3 through A5 as shown in the figure above.

    The follow code was used to test the LCD module to know if the connections made were correct when writing data to the display. The Read/Write (RW), Vss and LED- were connected to the ground (GND) pin of the 5V power rails whereas the Vdd and LED+ were connected to the Vcc pin of the 5V power rail.

    Testing and Results

    The result of the IoT Pulse monitoring project using LoRa
    The result of the IoT Pulse monitoring project using LoRa

    The project works very well, and it can send to both the receiver and also to the IoT dashboard when it can be further analyzed and remotely monitored. We included a Velcro patch to the transmitter side so that it can be strapped to the wrist to allow easy reading of the human body temperature and skin humidity.

    The human pulse beat showing on serial plotter
    The human pulse beat showing on serial plotter

    The image above shows the serial plotter of the pulse sensor when it is put on by the user. We can see the pulse that is being detected as it shows up on the screen.

    Conclusion

    The IoT Pulse, Body temperature, skin humidity monitoring project was a success within the scope of the experiment and design carried out. We would love to know if you did this project and was successful. The Iot Platform can be changed from thingspeak to Blynk cloud but bear in mind that Blynk only allow for 5 parameters on their free tier whereas thingspeak allows for 10 on each channel with a maximum channel of 4 for the free tier plan.

    Leave us a comment below if you tried to replicate this project and it worked for you. Perhaps you made some modifications and the project became some awesome. We would to hear from you. See you on the next project tutorial section.

    You May Also like…

    Frequently Asked Questions on IoT Pulse Rate Monitoring Project

    1. How does the system handle data loss during transmission?

    The system does not have built-in error correction, so if data is lost during transmission, it won’t be recovered. However, you can implement a checksum or acknowledgment mechanism in the code to ensure data integrity and request retransmission if errors are detected.

    2. Can I monitor the data on a mobile device?

    Yes, you can monitor the data on a mobile device by accessing the Thingspeak platform through a web browser or by using a mobile app that supports Thingspeak. Custom apps can also be developed using Thingspeak’s API for more tailored monitoring.

    3. What are the potential applications of this project beyond health monitoring?

    Beyond health monitoring, this project can be adapted for various environmental monitoring applications, such as tracking temperature and humidity in agricultural settings, remote weather stations, or even industrial environments where real-time data is crucial.

    4. How can I ensure the accuracy of the sensor readings?

    To ensure accuracy, you should regularly calibrate the sensors, particularly the DHT11, which can have slight variances. You can also compare the readings with a reference sensor and apply correction factors in the code if needed.

    5. What are the benefits of using ESP32 over other microcontrollers like Arduino?

    The ESP32 offers built-in WiFi and Bluetooth capabilities, making it ideal for IoT projects like this one. It also has a more powerful processor and more memory compared to traditional Arduino boards, allowing for more complex operations and better performance in real-time applications.

  • How to Build an IoT Pulse Rate Monitoring with ESP32 Arduino

    How to Build an IoT Pulse Rate Monitoring with ESP32 Arduino

    This is a finished project design that uses ESP32 board to read a DHT11 sensor for human temperature and humidity. It also reads the pulse rate of the person. using a pulse sensor module. The ESP32 is connected to a LoRa module, Sx1278, so that it can form a transmitter side. This will send the values of the parameters read to another design, the receiver side that has Arduino Nano board and another LoRa module connected to it; with an LCD that will display the values received. The ESP32 board also is programmed to to search for a WiFi network with internet access and send the values of the pulse rate, body temperature and humidity measured to a thingspeak platform.

    In the rapidly evolving world of IoT (Internet of Things), remote health monitoring systems have become increasingly important. This project leverages the power of the ESP32, LoRa modules, and the ThingSpeak platform to create a system that can monitor temperature, humidity, and pulse rate. The data is transmitted wirelessly to a remote receiver and is also uploaded to an online platform for easy access and monitoring.

    Introduction

    IoT Pulse Rate Monitoring project
    IoT Pulse Rate Monitoring project

    The integration of IoT in healthcare has paved the way for innovative solutions that can monitor patient health remotely. This project focuses on creating a system that reads body temperature, body humidity, and pulse rate using an ESP32, pulse rate sensor and DHT11 sensor. The data is transmitted via LoRa to a remote receiver, which displays the readings on an LCD. Additionally, the ESP32 is programmed to connect to WiFi and send the data to ThingSpeak, allowing for real-time monitoring over the internet

    Components/Modules Need For the IoT Pulse Rate Monitoring Project

    ITEM DESCRIPTIONQUANTITY
    LiPo CHARGING MODULE1
    LCD Module1
    3×6 INCH PATRESS BOX1
    Connector3
    RESISTORS2
    CONNECTING WIRES3 yards
    DHT11 Sensor1
    ECG SENSOR1
    LIPO BATTERY1
    SOLDER1
    SOLDERING IRON1
    Buzzer1
    ARDUINO NANO BOARD1
    ESP32 Dev BOARD11
    BUZZER1
    LCD MODULE1
    PULSE/HEART RATE SENSOR1
    OLED MODULE1
    FEMALE HEADERPIN2
    MISCELLANEOUS 

    Understanding the Components

    IoT Pulse Rate Monitoring: The ESP32 board and pulse rate monitor sensor module
    The ESP32 board and pulse rate monitor sensor module

    The ESP32 is a strong microcontroller that is developed by Expressif company in China; and it is a great option for Internet of Things projects because it has integrated WiFi and Bluetooth capabilities. It is appropriate for battery-operated devices since it has several GPIO pins, supports a range of communication protocols, and has a low power usage mode.

    While the pulse sensor detects changes in light absorption in blood vessels to measure heart rate, it is a common component of wearable health devices and is easily integrated into this ESP32 project. On the other hand, the DHT11 sensor is a low-cost digital sensor for measuring temperature and humidity. It provides a calibrated digital output and is easy to interface with any microcontroller. Hence our choice for it to read the user’s body temperature and skin humidity.

    Arduino Nano and LoRa module
    Arduino Nano and LoRa module for the IoT pulse rate monitoring project

    We needed to transmit the readings of the sensors from the user to a qualified personnel, say perhaps a doctor or a health professional wirelessly without having to incur the cost of data via internet. For such long-distance wireless communication, LoRa (Long Range) modules are utilized. They are renowned for their low power consumption and long-range data transmission capabilities (up to 10 km in open regions), and they operate in the unlicensed ISM bands.

    The receiver side of this project uses an Arduino Nano , this board is a compact version of the Arduino Uno and is often used in projects where space is limited. It has fewer GPIO pins than the Uno but is more than sufficient for this project.

    The LCD display will be used to show the temperature, humidity, and pulse rate values received by the Arduino Nano. The module was the 16×4 version and it worked very well for us to display all the parameters we received. , depending on the user’s preference.

    The Schematic Diagram for the IoT Pulse Rate Monitoring

    The transmitter side of the IoT Pulse monitoring project
    The transmitter side of the IoT Pulse monitoring project

    Explanation of the Schematic Diagram

    The IoT pulse and humidity monitoring project with LoRa technology schematic diagram
    The IoT pulse and humidity monitoring project with LoRa technology schematic diagram

    The schematic diagram showed that the project design for the transmitter was built around the ESP32 Development (dev) board. The ESP32 is powered by the output of the LiPo battery charging module. Which in turn was powered by the 3.3V LiPo battery. The type of circuitry found in the module made it very easy for us to get an output of 5V by regulating the onboard potentiometer on the module.

    This 5V logic is then paralleled across the sensors that used 5V as their input logic voltage. This is the digital humidity and temperature sensor (DHT11) and the pulse/heart rate sensor module. The ESP32 has an onboard regulator that can output 3.3V and this is connected to the LoRa module since it can only support 3.3V logic voltage for its operation. All the Ground (GND) pins are connected together to ensure the system works as expected. The 0.96 inch OLED (organic light emitting diode) consumes 5V and can still work on 3.3V but we connected it to the 5V power rail to ensure optimum performance.

    Connection of the LoRa Module

    The IoT pulse and humidity monitoring project with LoRa technology schematic diagram
    The IoT pulse and humidity monitoring project with LoRa technology schematic diagram

    The connection of the LoRa module was done using the Serial Peripheral Interface (SPI). The LoRa module has for SPI pins. The MISO (master in, slave out) which was connected to GPIO (general purpose input output) 19 on the ESP32 dev board, MOSI (Master out, slave in) which was connected to GPIO pin 22 on the ESP32, SCK (serial clock) is connected GPIO 18. tHe Input output (IO) 0 on the LoRa module is connected to the GPIO pin 2 on the ESP32, whereas, the reset pin of the LoRa module is connected to the ESP32 GPIO pin 14.

    Explanation for DHT11 Sensor Connection

    How the DHT11 sensor was connected in the schematic diagram
    How the DHT11 sensor was connected in the schematic diagram

    The ESP32 dev board read the dht11 connected to its GPIO pin 21, the digital input pin of the DHT11 that is. The power rails of the DHT11 sensor is connected to the 5V logic. For the DHT11 to work precisely, a 10kΩ precision resistor is added by connected it between the Vcc and the GND pins respectively.

    The Arduino Nano Board (Receiver Side)

    connection of the Nano board with the LoRa module
    connection of the Nano board with the LoRa module

    Since the connection needed an SPI protocol, the SPI buses on the Arduino Nano were used as shown in the schematic diagram above. Once these connections were ensured, the program code below was uploaded into the Arduino Nano to receive data from the transmitter side of the project.

    connection of the Nano board with the LoRa module
    connection of the Nano board with the LoRa module

    The both systems are running on rechargeable power option. The type of power modules used in the transmitter and the receiver side allowed us to charge the 3.3V LiPo battery and get 5V output to power and run each system effectively.

    Programming the Project Design

    Arduino Program Code for the ESP32 (Transmitter Side)

    #include <WiFi.h>
    #include "ThingSpeak.h"
    #include <SPI.h>
    #include <LoRa.h>
    #include "DHT.h"
    //
    #include <Wire.h>
    #include <Adafruit_GFX.h>
    #include <Adafruit_SSD1306.h>
    //
    #define SCREEN_WIDTH 128 // OLED display width, in pixels
    #define SCREEN_HEIGHT 64 // OLED display height, in pixels
    
    // Declaration for an SSD1306 display connected to I2C (SDA, SCL pins)
    Adafruit_SSD1306 display(SCREEN_WIDTH, SCREEN_HEIGHT, &Wire, -1);
    
    
    const char* ssid = "Galaxy A51 917E";   // your network SSID (name) 
    const char* password = "ancsucre21";   // your network password
    //set the instance for High BP and Low BP
    #define HBPpin 13
    #define LBPpin 27
    
    WiFiClient  client;
    
    unsigned long myChannelNumber = 1;
    const char * myWriteAPIKey = "MTL2US26KL1BFUT1";
    // Timer variables
    unsigned long lastTime = 0;
    unsigned long timerDelay = 10000;
    
    //define where the heart rate sensor is connected
    #define sensorPinout 12
    int sensorPin;
    // Digital pin connected to the DHT sensor
    #define DHTPIN 4
    //define where the buzzer is connected
    #define buzzerPin 15
    
    int counter = 0;
    bool panic;
    float h, t, f;
    int sensorAnalog,heartRate, checkHBP, checkLBP = 0; 
    String greeting = "hello";
    
    //define the pins used by the transceiver module
    #define ss 5
    #define rst 14
    #define dio0 2
     // DHT 11
    #define DHTTYPE DHT11
    // as the current DHT reading algorithm adjusts itself to work on faster procs.
    DHT dht(DHTPIN, DHTTYPE);
    
    void loraSetup(){
      while (!Serial);
      Serial.println("LoRa Sender");
    
      //setup LoRa transceiver module
      LoRa.setPins(ss, rst, dio0);
      
      //replace the LoRa.begin(---E-) argument with your location's frequency 
      //433E6 for Africa & Asia
      //866E6 for Europe
      //915E6 for North America
      while (!LoRa.begin(433E6)) {
        Serial.println(".");
        delay(500);
      }
       // Change sync word (0xF3) to match the receiver
      // The sync word assures you don't get LoRa messages from other LoRa transceivers
      // ranges from 0-0xFF
      LoRa.setSyncWord(0xF3);
      Serial.println("LoRa Initializing OK!");
    }
    
    void thingspeakSetup(){
      WiFi.mode(WIFI_STA);     
      ThingSpeak.begin(client);  // Initialize ThingSpeak
    // Connect or reconnect to WiFi
        if(WiFi.status() != WL_CONNECTED){
          Serial.print("Attempting to connect");
          while(WiFi.status() != WL_CONNECTED){
            WiFi.begin(ssid, password); 
            delay(5000);     
          } 
          Serial.println("\nConnected.");
        }   
    }
    
    void setup() {
    //initialize Serial Monitor
      Serial.begin(115200);
    //begin the dht sensor
     dht.begin();
    //start the thingspeak setup
    thingspeakSetup();
    //start the LoRa setup
    loraSetup();
    //set ur inputs and outouts make the buzzer an output
    pinMode(buzzerPin, OUTPUT);
    pinMode(HBPpin, INPUT_PULLUP);
    pinMode(LBPpin, INPUT_PULLUP);
    //check for display
    if(!display.begin(SSD1306_SWITCHCAPVCC, 0x3C)) { // Address 0x3D for 128x64
        Serial.println(F("SSD1306 allocation failed"));
        for(;;);
      }
      delay(2000);
      display.clearDisplay();
    
      display.setTextSize(1);
      display.setTextColor(WHITE);
      // Display static text at column 10 row 0
      display.setCursor(0, 10);
      display.println("  WELCOME SOPHIA");
      display.setCursor(0, 20);
      display.println("  LoRa & IoT BASED ");
      display.setCursor(0, 30);
      display.println(" PROJECT ");
      display.display(); 
    }
    
    int heartRateReader(){
      sensorPin = analogRead(sensorPinout);                 // wait for a second
      //  delay(500);
      return sensorPin;
    }
    
    float dhtSensor(){
      // Reading temperature or humidity takes about 250 milliseconds!
      // Sensor readings may also be up to 2 seconds 'old' (its a very slow sensor)
       h = dht.readHumidity();
      // Read temperature as Celsius (the default)
       t = dht.readTemperature();
      // Read temperature as Fahrenheit (isFahrenheit = true)
       f = dht.readTemperature(true);
    return h, t, f;
      // Check if any reads failed and exit early (to try again).
      if (isnan(h) || isnan(t) || isnan(f)) {
        Serial.println(F("Failed to read from DHT sensor!"));
      }
    
      // Compute heat index in Fahrenheit (the default)
      float hif = dht.computeHeatIndex(f, h);
      // Compute heat index in Celsius (isFahreheit = false)
      float hic = dht.computeHeatIndex(t, h, false);
    }
    
    int checkHeartCondition(){
     checkHBP = digitalRead(HBPpin);
     checkLBP = digitalRead(LBPpin);
     return checkHBP, checkLBP;
    }
    
    void panicDisplay(){
      display.clearDisplay();
        display.setTextColor(SSD1306_WHITE);        // Draw white text
     display.setCursor(0, 5);
     //display.setTextSize(2);
     display.setTextSize(1);
     display.print("Abnorma Levels Detected. \nContact a Medical Expert Soon ");
     display.display(); 
    }
    
    int raiseAlarm(){
      checkHeartCondition();
      dhtSensor();
    
       if(sensorPin == 0){
        sensorPin = 60;
        digitalWrite(buzzerPin, LOW);
        panic = false;
      }
    
      if(checkHBP == LOW){
        sensorPin = 240;
        digitalWrite(buzzerPin, HIGH);
        //panicDisplay();
        panic = true;
      }
    
      if(checkLBP == LOW){
        sensorPin = 0;
        digitalWrite(buzzerPin, HIGH);
        //panicDisplay();
        //panic = true;
      }
        
      //check if the alrm should sound
      if((h >= 100.00) || (t >= 50.00)){
        digitalWrite(buzzerPin, HIGH);
        //panicDisplay();
        panic = true;
      }
    
      else{
        sensorPin /= 2;
        panic = false;
      }
    
      return panic, sensorPin;
    }
    
    void oledDisplay(){
      raiseAlarm();
      
      if(panic != true){
        display.clearDisplay();
        display.setTextColor(SSD1306_WHITE);        // Draw white text
    
     display.setCursor(0, 5);
     display.setTextSize(1);
     display.print("H.R: ");
     display.setTextSize(2);
     //display.setCursor(5, 5);
     display.print(sensorPin);
      display.setTextSize(1);
      display.print(" bpm");
      
      
      display.setCursor(0, 25);
      display.setTextSize(1);
     display.print("B.H: ");
     display.setTextSize(2);
      display.print(h);
      display.setTextSize(1);
      display.print(" %");
      
      display.setCursor(0, 45);
      display.setTextSize(1);
     display.print("B.T: ");
     display.setTextSize(2);
      display.print(t);
      display.setTextSize(1);
      display.print("'C");
        
       display.display(); 
      }
     
      else IF (panic == true){
        display.clearDisplay();
        display.setTextColor(SSD1306_WHITE);        // Draw white text
        display.setTextSize(1);
        display.print("SOMETHING IS WRONG \nPLEASE SEE A DOCTOR\nSOON!!!");
        display.display();
    
      }
    }
    
    void sendTruLoRa(){
      Serial.println("<<<Sending packet>>>");
      Serial.print("hum: ");Serial.print(h);
      Serial.print(" temp: "); Serial.print(t);
      Serial.print(" heart rate: "); 
      Serial.println(sensorPin);
    
      //Send LoRa packet to receiver
      LoRa.beginPacket();
      //use delimiters
      LoRa.print('<');
      LoRa.print(greeting); LoRa.print(',');
      LoRa.print(h);LoRa.print(',');
      LoRa.print(t);LoRa.print(',');
      LoRa.print(sensorPin);LoRa.print('>');
      LoRa.endPacket();
    
    }
    
    
    void sendToThingspeak(){
     raiseAlarm();
      oledDisplay();
      
      if ((millis() - lastTime) > timerDelay) {
    // pieces of information in a channel.  Here, we write to field 1.
        int x = ThingSpeak.writeField(myChannelNumber, 1, sensorPin, myWriteAPIKey);
        int y = ThingSpeak.writeField(myChannelNumber, 2, h, myWriteAPIKey);
        int z = ThingSpeak.writeField(myChannelNumber, 3, t, myWriteAPIKey);
        //uncomment if you want to get temperature in Fahrenheit
        //int x = ThingSpeak.writeField(myChannelNumber, 1, temperatureF, myWriteAPIKey);
    
        if(x == 200){
          Serial.println("Channel update successful.");
        }
        else{
          Serial.println("Problem updating channel. HTTP error code " + String(x));
        }
        lastTime = millis();    
        }
     delay(1000);
    //raiseAlarm();
    //oledDisplay();
    sendTruLoRa();  
    }
    
    void loop() {
      //heartRateReader();
      
     sendToThingspeak();
     delay(200); 
    }


    Given the condition that no test patient would be allowed to go into cardiac arrest for this project, two push buttons were used as shown above to simulate these conditions physically. The push buttons when depressed acted as going into a high pulse rate and low pulse rate. The program code allowed us to read the states of the pushbuttons.

    The code above when uploaded and the serial monitor opened. The results show the received data from the transmitter end. And each count that was sent for each burst of transmitted data.

    Arduino Program Code for the Arduino Nano board (Receiver Side)

    #include <SPI.h>
    #include <LoRa.h>
    
    //define the pins used by the transceiver module
    #define ss 5
    #define rst 14
    #define dio0 2
    
    void setup() {
      //initialize Serial Monitor
      Serial.begin(115200);
      while (!Serial);
      Serial.println("LoRa Receiver");
    
      //setup LoRa transceiver module
      LoRa.setPins(ss, rst, dio0);
      
      //replace the LoRa.begin(---E-) argument with your location's frequency 
      //433E6 for Asia
      //866E6 for Europe
      //915E6 for North America
      while (!LoRa.begin(866E6)) {
        Serial.println(".");
        delay(500);
      }
       // Change sync word (0xF3) to match the receiver
      // The sync word assures you don't get LoRa messages from other LoRa transceivers
      // ranges from 0-0xFF
      LoRa.setSyncWord(0xF3);
      Serial.println("LoRa Initializing OK!");
    }
    
    void loop() {
      // try to parse packet
      int packetSize = LoRa.parsePacket();
      if (packetSize) {
        // received a packet
        Serial.print("Received packet '");
    
        // read packet
        while (LoRa.available()) {
          String LoRaData = LoRa.readString();
          Serial.print(LoRaData); 
        }
    
        // print RSSI of packet
        Serial.print("' with RSSI ");
        Serial.println(LoRa.packetRssi());
      }
    }


    The LCD (liquid crystal display) module was connected using the 4-bit communication protocol that means that only 4 wires were needed for the writing of data from the Nano board to the LCD module. The Register Select (RS) and the Enable (E) was connected to the  A2 and A1 respectively while the data pins D4 through D7 was connected to A0, A3 through A5 as shown in the figure above.

    The follow code was used to test the LCD module to know if the connections made were correct when writing data to the display. The Read/Write (RW), Vss and LED- were connected to the ground (GND) pin of the 5V power rails whereas the Vdd and LED+ were connected to the Vcc pin of the 5V power rail.

    Testing and Results

    The result of the IoT Pulse monitoring project using LoRa
    The result of the IoT Pulse monitoring project using LoRa

    The project works very well, and it can send to both the receiver and also to the IoT dashboard when it can be further analyzed and remotely monitored. We included a Velcro patch to the transmitter side so that it can be strapped to the wrist to allow easy reading of the human body temperature and skin humidity.

    The human pulse beat showing on serial plotter
    The human pulse beat showing on serial plotter

    The image above shows the serial plotter of the pulse sensor when it is put on by the user. We can see the pulse that is being detected as it shows up on the screen.

    Conclusion

    The IoT Pulse, Body temperature, skin humidity monitoring project was a success within the scope of the experiment and design carried out. We would love to know if you did this project and was successful. The Iot Platform can be changed from thingspeak to Blynk cloud but bear in mind that Blynk only allow for 5 parameters on their free tier whereas thingspeak allows for 10 on each channel with a maximum channel of 4 for the free tier plan.

    Leave us a comment below if you tried to replicate this project and it worked for you. Perhaps you made some modifications and the project became some awesome. We would to hear from you. See you on the next project tutorial section.

    You May Also like to Read…

    How to Make Money on Facebook Marketplace

    Should Teens Be Allowed to Obtain Birth Control Pills?

    Famous Celebrities Who Battled and Beat Cancer

    Celebrities Who Don’t Believe In God

    Frequently Asked Questions on IoT Pulse Rate Monitoring Project

    1. How does the system handle data loss during transmission?

    The system does not have built-in error correction, so if data is lost during transmission, it won’t be recovered. However, you can implement a checksum or acknowledgment mechanism in the code to ensure data integrity and request retransmission if errors are detected.

    2. Can I monitor the data on a mobile device?

    Yes, you can monitor the data on a mobile device by accessing the Thingspeak platform through a web browser or by using a mobile app that supports Thingspeak. Custom apps can also be developed using Thingspeak’s API for more tailored monitoring.

    3. What are the potential applications of this project beyond health monitoring?

    Beyond health monitoring, this project can be adapted for various environmental monitoring applications, such as tracking temperature and humidity in agricultural settings, remote weather stations, or even industrial environments where real-time data is crucial.

    4. How can I ensure the accuracy of the sensor readings?

    To ensure accuracy, you should regularly calibrate the sensors, particularly the DHT11, which can have slight variances. You can also compare the readings with a reference sensor and apply correction factors in the code if needed.

    5. What are the benefits of using ESP32 over other microcontrollers like Arduino?

    The ESP32 offers built-in WiFi and Bluetooth capabilities, making it ideal for IoT projects like this one. It also has a more powerful processor and more memory compared to traditional Arduino boards, allowing for more complex operations and better performance in real-time applications.

  • How to Build an IoT Based Temperature Control Poultry Farm Arduino

    How to Build an IoT Based Temperature Control Poultry Farm Arduino

    The objective of this project is to develop and build an Arduino-based IoT platform temperature control and monitoring system that reads and adjusts the temperature and humidity around the poultry farm living quarters using a digital humidity and temperature sensor, DHT11. A chicken’s body temperature typically ranges from 41.5 degrees Celsius to 42.5 degrees Celsius, depending on its surroundings, as long as air movement—which typically ranges from 10 to 15 degrees below the body temperature—is present. The Arduino unique microcontroller Atmega328P-PU, which was designed to communicate with a Wi-Fi module using the Arduino IDE, would form the foundation of the proposed system.

    IoT Based Temperature Control Poultry Farm Arduino
    IoT Based Temperature Control Poultry Farm Arduino

    The Android phone and Wi-Fi module will be linked so that the status of this chicken farm may be viewed and managed remotely from that device. The Android device would run an app that was created exclusively with MIT AI2 AppInventor or RemoteXY to show the temperatures on its screen. The app would also allow the user(s) to control the temperature by pressing a button on the screen, which would eliminate the need for energy-sucking tungsten AC bulbs. Having now had a broad understanding of the project design. A little introduction is provided before we get into the specifics of how to create the temperature monitoring design for chicken farms using the Android platform.

    Why Do We Need to Monitor Temperature In Poultry Farms

    According to expert advice on chicken farming, a farm’s temperature parameter accounts for two thirds of the environmental influence on its live stocks, in this example, birds. For instance, the ideal temperature range for incubating chicken eggs is between 99 and 102 degrees Fahrenheit. Day-old chicks maintain steady growth at approximately 92 degrees Fahrenheit. A 2009 study found that hot weather has a detrimental impact on domestic animals’ performance and general health. Heat stress brought on by high temperatures increases chicken production’s mortality rate and financial loss. Birds must maintain thermobalance in order to be in harmony with their surroundings and function at their best.

    Birds are subject to heat stress when the air temperature and humidity uncontrollably increase their core body temperature
    Birds are subject to heat stress when the air temperature and humidity uncontrollably increase their core body temperature

    The equilibrium between the quantity of heat released by a living thing at any given time and the amount of heat it produces is known as thermobalance. And within any specific species’ thermoneutral range, this is said to be at its maximal physiological level. As homoeothermic mammals, birds can tolerate some temperature variation without experiencing a severe disruption, yet they nevertheless maintain a generally steady body temperature.

    IoT Based Temperature Control Poultry Farm Arduino: Components Needed

    ComponentsQuantity
    Arduino Uno board1
    Digital Humidity and Temperature Sensor DHT111
    5V >=4A DC Power Supply1
    5V Single channel relay module1
    220-240V Tungsten Alternating Current (AC) light bulb1
    ESP8266-01 (ESP-01) WiFi Module1
    Jumper wires1
    SPST Switch1
    Bill o f materials for the project

      The aforementioned components are the most crucial. The microcontroller development board that will be utilized to program the DHT11 sensor’s reaction to temperature and humidity changes in its environment is the Arduino Uno board. The components and modules used for this project design operates on Direct Current (DC) power from the 5V power source. Hence, the Arduino Uno and the sensor run on that voltage level.

      The purpose of the ESP-01 Module is to link to a WiFi network with internet access, enabling the user to access, monitor, and control the chicken farm remotely. The AC tungsten light bulb’s on and off functions are managed by the 5V single channel relay module. Because the idea was to use the heat this tungsten light bulb emits to regulate the surrounding temperature of the birds.

      The Digital Humidity and Temperature, DHT11 Sensor Works

      IoT Based Temperature Control Poultry Farm Arduino: The DHT11 module
      IoT Based Temperature Control Poultry Farm Arduino: The DHT11 module

      The DHT11 sensor module is a digital temperature and humidity sensor that measures environmental conditions. It consists of a thermistor (temperature sensor) and a humidity sensor, which work together to provide accurate readings. The module sends a digital signal to a microcontroller or other device, making it easy to integrate into various projects.

      The DHT11 sensor measures temperature between -40°C to 80°C (-40°F to 176°F) with an accuracy of ±2°C (±4°F). For humidity, it measures between 20% to 90% relative humidity (RH) with an accuracy of ±5% RH. The sensor has a capacitive humidity sensor and a thermistor to measure temperature, which are connected to a simple microcontroller that processes the data.

      When the DHT11 sensor is powered, it sends a 40-bit digital signal to the microcontroller development board, which includes 16 bits for temperature, 16 bits for humidity, and 8 bits for a checksum (error-checking data). The microcontroller can then decode this signal to get the temperature and humidity readings.

      The Schematic Diagram for the IoT Based Temperature Control Poultry Farm Arduino Project

      The Schematic Diagram for  the IoT Based Temperature Control Poultry Farm Arduino Project
      The Schematic Diagram for the IoT Based Temperature Control Poultry Farm Arduino Project

      Circuit Connections And Explanation

      We included an LCD for people who are closer to the project design who wants to see what the project is actually measuring at any particular time. This would help in knowing the accuracy of the project design too.

      1. Connecting the DHT11 Sensor Module

      • DHT11 Pinout:
        • VCC: Power supply (typically 5V)
        • DOUT: digital output voltage proportional to humidity and temperature
        • GND: Ground
      • Connections to Arduino Uno:
        • VCC of DHT11 to 5V on Arduino Uno
        • GND of DHT11 to GND on Arduino Uno
        • OUT of DHt11 to D6 (digital input) on Arduino Uno

      2. Connecting the ESP-01 WiFi Module

      The Circuit Diagram for the IoT Based Temperature Control Poultry Farm Arduino Project
      The Circuit Diagram for the IoT Based Temperature Control Poultry Farm Arduino Project
      • ESP-01 Pinout:
        • VCC: Power supply (3.3V)
        • GND: Ground
        • TX: Transmit data (UART)
        • RX: Receive data (UART)
        • CH_PD: Chip enable (connect to 3.3V)
        • GPIO0: General-purpose input/output (connect to 3.3V for normal operation)
        • GPIO2: General-purpose input/output (not used in this project)
        • RST: Reset (not used in this project)
      • Connections to Arduino Uno:
        • VCC of ESP-01 to 3.3V on Arduino Uno (important: ESP-01 operates at 3.3V, not 5V)
        • GND of ESP-01 to GND on Arduino Uno
        • TX of ESP-01 to RX on Arduino Uno (through a voltage divider to step down 5V to 3.3V)
        • RX of ESP-01 to TX on Arduino Uno (direct connection)
        • CH_PD of ESP-01 to 3.3V on Arduino Uno
        • GPIO0 of ESP-01 to 3.3V on Arduino Uno

      3. Connecting the Relay Module

      • Relay Pinout:
        • VCC: Power supply (typically 5V)
        • GND: Ground
        • IN: Control signal from Arduino
        • COM: Common terminal for switching
        • NO: Normally open terminal
        • NC: Normally closed terminal
      • Connections to Arduino Uno:
        • VCC of Relay to 5V on Arduino Uno
        • GND of Relay to GND on Arduino Uno
        • IN of Relay to any digital pin on Arduino Uno (e.g., D8)
      • Connections for Control (AC light Bulb):
        • Connect the controlled device (heater ) to COM and NO (for normally open configuration) or COM and NC (for normally closed configuration) on the relay module.

      Programming the Project Design

      Now, let us program the project design. we need some basic libraries for this project code to work on the Arduino IDE. We installed the DHT11 library using this link here. And since we finally decided to go with the RemoteXY app for the remote IOT monitoring, we equally installed their library from here.

      #include <Adafruit_Sensor.h>
      #include <DHT.h>
      #include <DHT_U.h>
      #include <Wire.h>
      #include <LiquidCrystal_I2C.h>
      
      /*
         -- Smart Farm --
         
         This source code of graphical user interface 
         has been generated automatically by RemoteXY editor.
         */
      
      // RemoteXY select connection mode and include library 
      #define REMOTEXY_MODE__ESP8266_HARDSERIAL_POINT
      
      #include <RemoteXY.h>
      
      // RemoteXY connection settings 
      #define REMOTEXY_SERIAL Serial
      #define REMOTEXY_SERIAL_SPEED 115200
      #define REMOTEXY_WIFI_SSID "DAMI FARM"
      #define REMOTEXY_WIFI_PASSWORD "12345678"
      #define REMOTEXY_SERVER_PORT 6377
      
      // RemoteXY configurate  
      #pragma pack(push, 1)
      uint8_t RemoteXY_CONF[] =
        { 255,1,0,47,1,85,0,8,45,2,
        2,1,37,28,16,8,20,31,26,12,
        2,32,31,31,79,78,0,79,70,70,
        0,67,0,1,40,98,6,1,59,61,
        7,31,26,101,67,0,1,48,98,6,
        1,73,61,7,2,26,101,67,0,1,
        56,98,6,1,88,61,7,13,26,101,
        129,0,6,2,89,16,5,5,55,10,
        2,83,109,97,114,116,32,70,97,114,
        109,0 };
        
      // this structure defines all the variables of your control interface 
      struct {
          // input variable
        uint8_t SW1; // =1 if switch ON and =0 if OFF 
      
          // output variable
        char SCREEN1[101];  // string UTF8 end zero 
        char SCREEN2[101];  // string UTF8 end zero 
        char SCREEN3[101];  // string UTF8 end zero 
      
          // other variable
        uint8_t connect_flag;  // =1 if wire connected, else =0 
      
      } RemoteXY;
      #pragma pack(pop)
      
      /////////////////////////////////////////////
      //           END RemoteXY include          //
      /////////////////////////////////////////////
      
      #define PIN_SW1 8
      
      // what digital pin we're connected to
      #define DHTPIN 6    
      #define DHTTYPE DHT11   // DHT 11
      
      DHT dht(DHTPIN, DHTTYPE);
      LiquidCrystal_I2C lcd(0x27, 16, 2); // Set the LCD address to 0x27 for a 16 chars and 2 line display
      
      void setup() {
        RemoteXY_Init (); 
        
        pinMode (PIN_SW1, OUTPUT);
        dht.begin();
        lcd.begin();
        lcd.backlight();
      }
      
      void soilMonitor() {
        // read the input on analog pin 0:
        int sensor = analogRead(A0);
        // Convert the analog reading (which goes from 0 - 1023) to a range (0 - 100):
        double TP = sensor * (100 / 1023.0);
      
        int soil = TP;
        if((soil < 40) || (soil == 40) && (RemoteXY.SW1 == 0)) {
          digitalWrite(PIN_SW1, HIGH);
          strcpy (RemoteXY.SCREEN3, "Pump in AUTO Mode");
        }
      }
      
      void loop() { 
        RemoteXY_Handler ();
        soilMonitor();
        
        // read the input on analog pin 0:
        int sensor = analogRead(A0);
        // Convert the analog reading (which goes from 0 - 1023) to a range (0 - 100):
        double TP = sensor * (100 / 1023.0);
      
        int soil = TP;
      
        sprintf (RemoteXY.SCREEN1, "The Soil moisture reading is: %d", soil);
      
        if ((soil < 60) && (RemoteXY.SW1 ==1)) {
          digitalWrite(PIN_SW1, HIGH);
          strcpy (RemoteXY.SCREEN3, "Manual Override: Pump running");
        }
        if ((soil > 40) && (soil < 60) && (RemoteXY.SW1 == 0)) {
          digitalWrite(PIN_SW1, LOW);
          strcpy (RemoteXY.SCREEN3, "Pump is not running");
        }
        if((soil > 60) && (RemoteXY.SW1 ==1)) {
          digitalWrite(PIN_SW1, LOW);
          strcpy (RemoteXY.SCREEN3, "Warning!!! Farm Flooded, System AUTO Shut Off Pump");
        }
        if((soil > 60) && (RemoteXY.SW1 ==0)) {
          digitalWrite(PIN_SW1, LOW);
          strcpy (RemoteXY.SCREEN3, "Thanks, Farm Flooding Averted.");
        }
      
        float h = dht.readHumidity();
        // Read temperature as Celsius (the default)
        float t = dht.readTemperature();
        int Temp = t;
        int Hum = h;
        
        // Check if any reads failed and exit early (to try again).
        if (isnan(h) || isnan(t)) {
          strcpy (RemoteXY.SCREEN3, "Warning!!! Failed to read from DHT sensor!");
          return;
        }
      
        sprintf (RemoteXY.SCREEN2, "Farm Humidity is: %d, Temperature is: %d'C", Hum, Temp);
        
        // Display the temperature and humidity on the LCD
        lcd.setCursor(0, 0);
        lcd.print("Temp: ");
        lcd.print(Temp);
        lcd.print((char)223); // Degree symbol
        lcd.print("C  ");
      
        lcd.setCursor(0, 1);
        lcd.print("Humidity: ");
        lcd.print(Hum);
        lcd.print("%");
      }


      Explanation of the Code

      1. Library Addition:
        • #include <Wire.h>
        • #include <LiquidCrystal_I2C.h>
        These libraries were added to support the I2C LCD display.
      2. LCD Initialization:
        • LiquidCrystal_I2C lcd(0x27, 16, 2);
        This line initializes the LCD with the I2C address 0x27 and sets it up for 16 columns and 2 rows.
      3. LCD Setup:
        • lcd.begin();
        • lcd.backlight();
        These lines initialize the LCD and turn on the backlight in the setup() function.
      4. LCD Display:
        • The temperature and humidity readings are displayed on the LCD using lcd.setCursor() and lcd.print() functions.

      Project System Design Expansion

      To account for some changes, we had to incorporate an additional module to the schematic diagram as shown above. We reasoned about watering and supplying water to the poultry bird for drinking. And we wanted to remotely do this, and also ensure we know the level of water left in their drinking bowl.

      The Schematic Diagram for the IoT Based Temperature Control with feeding
      The Schematic Diagram for the IoT Based Temperature Control with feeding

      We used a soil moisture meter or sensor module to achieve this feat. This will tell us what the level of the drinking water is at any particular time. The program code allowed us to control it in two modes: the automatic mode and the user mode. The Automatic mode is when the system regulate the feeding water to the poultry birds by itself and the user mode is where the user does the turning on or off of the pump supplying water to the bird’s drinking bowl.

      Integration and Testing

      The Schematic Diagram for the IoT Based Temperature Control with feeding

      Real Life Applications and Importance Benefits of the Project Design

      Putting such a system in place emphasizes how crucial it is to incorporate contemporary technology into conventional farming methods in order to create sustainable and effective agricultural operations. By using this robust and scalable Android platform-based solution, poultry producers can better manage temperature and oversee operations to accommodate their changing needs.

      Other functions include:

      • Enhanced Monitoring: Real-time temperature monitoring enables proactive management of poultry farm conditions.
      • Remote Accessibility: Accessibility via Android platform allows farm managers to monitor and control temperature parameters remotely, improving operational efficiency.
      • Data Logging and Analysis: The system can log temperature data over time, facilitating historical analysis and trend identification for informed decision-making.

      Conclusion

      An important development in agricultural technology is the temperature monitoring system for chicken farms that is based on the IoT smart phone platform. Poultry producers can attain accurate temperature and humidity control and monitoring capabilities by utilizing an Arduino Uno, as well as drinking water for the birds by using the DHT11 sensor, the moisture sensor and an ESP-01 WiFi module. In addition to improving the welfare of poultry birds, this maximizes farm output and streamlines operations.

      Let us know if you replicated this project design in the comment section below. We hope to hear from you soon. Good luck!

      Read Also…

      IoT Pump Control for Efficient Irrigation Systems

      Frequently asked questions (FAQs) related to the project

      1. What is the purpose of this Smart Poultry Farm project?

      • Answer: The Smart Poultry Farm project is designed to monitor soil moisture, temperature, and humidity levels in a farm environment. It automates irrigation by controlling a water pump based on soil moisture readings and provides real-time data on farm conditions via an LCD display and a mobile interface using RemoteXY.

      2. How does the soil moisture sensor work in this project?

      • Answer: The soil moisture sensor measures the water content in the feeding bowl by detecting the electrical resistance between its probes. The analog readings from the sensor are converted into a percentage value, which the system uses to determine whether the feeding is dry, adequately moist, or flooded. Based on these readings, the system automatically turns the water pump on or off from the supply reservoir through the DC pump connected to an external relay or NPN transistor.

      3. What role does the DHT11 sensor play in this project?

      • Answer: The DHT11 sensor is used to measure the temperature and humidity levels in the farm environment. The data collected by this sensor is displayed on an LCD screen and sent to a mobile device via the RemoteXY app. This information helps farmers monitor environmental conditions that could affect bird’s growth and welfare.

      4. How is the water pump controlled in this project?

      • Answer: The water pump is controlled using a relay connected to the Arduino. The relay acts as a switch that the Arduino can turn on or off based on moisture meter readings. If the moisture meter is below a certain threshold, the pump is activated to water the drinking bowl. If the water bowl is sufficiently moist or flooded, the pump is turned off to prevent overwatering.

      5. How can I view the real-time data and control the system remotely?

      • Answer: The project uses the RemoteXY platform, which allows you to connect your Arduino to a mobile device over Wi-Fi. The real-time data, including soil moisture, temperature, and humidity, can be viewed on your smartphone, and you can control the water pump manually through the app. The LCD screen also displays this data locally, providing both remote and on-site monitoring options.
    • DIY Home Safety: Automated Window System with Arduino

      DIY Home Safety: Automated Window System with Arduino

      In the modern age, home automation is no longer just a luxury; it’s a necessity for enhancing safety, convenience, and energy efficiency. One of the more innovative and practical DIY projects that integrates automation with safety is an automated window system with Arduino. This system is designed to automatically close your windows when it detects rain, smoke, or harmful gases, and reopen them when the environment is clear and safe. Whether you’re a seasoned maker or just starting your journey into the world of electronics, this project is an excellent way to improve your home while learning valuable skills.

      Automated Window System With Arduino
      Automated Window System With Arduino

      In this comprehensive guide, we’ll walk you through the process of creating this automated window system. We’ll cover everything from understanding the components to wiring and coding, and finally, testing and optimizing the system for real-world use. By the end of this post, you’ll have a fully functional, smart window automation system that enhances your home’s safety and provides you with a sense of accomplishment.

      Introduction to Smart Window Automation

      Automated Window System With Arduino
      A typical automatic door mechanism

      Smart home technology is transforming the way we live, offering solutions that make our lives easier and safer. One such innovation is the automated window system. This system not only provides convenience by automating the opening and closing of windows but also serves as a crucial safety feature. Imagine a scenario where you’re away from home, and suddenly it starts raining. With a smart window system, there’s no need to rush back home; the windows will close automatically, protecting your home from water damage.

      Moreover, the system can detect dangerous smoke or harmful gases, automatically closing the windows to prevent these hazards from entering your living space. This feature is particularly useful in preventing smoke from wildfires, gas leaks, or other similar dangers. Once the environment is safe, the windows reopen, ensuring your home remains well-ventilated.

      Automatic Sliding window
      Automatic Sliding window

      Building this system yourself not only saves money but also gives you control over customization. You can tailor the system to your specific needs, and the knowledge gained from this project can be applied to other DIY home automation projects.

      Understanding the Components Needed for the Automated Window System with Arduino Project

      Before diving into the build process, it’s essential to understand the components that make up the system. Each component plays a critical role in ensuring the system functions correctly.

      Arduino Uno

      The Arduino uno board
      The Arduino uno board

      The Arduino Uno is the brain of this project. It’s a microcontroller board that processes inputs from various sensors and sends commands to the actuators to open or close the window. The Arduino Uno is user-friendly and has a vast community support, making it ideal for beginners and experienced makers alike.

      Rain Sensor

      Automated Window System With Arduino: The rain sensor module used for the project
      Automated Window System With Arduino: The rain sensor module used for the project

      The rain sensor detects moisture and sends a signal to the Arduino to close the window when it starts raining. This sensor is crucial for protecting your home from water damage during unexpected showers.

      Smoke Detector Sensor

      The smoke sensor module used for the Automated Window System With Arduino project
      The smoke sensor module used for the Automated Window System With Arduino project

      The smoke detector sensor is responsible for sensing dangerous smoke inside the room. If smoke is detected, the Arduino will command the actuators to close the window, preventing smoke from entering and protecting your home from potential fire hazards.

      Gas Sensor (MQ-2)

      The MQ-2 gas sensor detects harmful gases such as carbon monoxide, methane, and LPG. If these gases are detected, the system will automatically close the window to prevent these toxic substances from entering your living space.

      Actuators (Servos or Motors)

      DC motor used as actuator for the project design
      DC motor used as actuator for the project design

      Actuators are the mechanical components that physically open and close the window. They receive signals from the Arduino and convert them into motion. Depending on your window’s size and type, you can choose between servos or motors.

      Old DVD tray mechanism for constructing a slider door
      Old DVD tray mechanism for constructing a slider door

      For this project design, we used a 5V DC motor which we pull off from the DVD tray mechanism of an old DVD player. We built a house model/home model that focused on bringing out the Window side view more. And the windows were constructed with the sliding part of these mechanisms.

      L293D Motor Driver IC and Motor Module

      L293D motor driver IC used for this project design
      L293D motor driver IC used for this project design

      The module version would have been the best to use since it offer a seamless plug and play use. However, the cost of this module is also an important factor to consider. To solve this, we just the driver IC itself. It is much cheaper and offer the same solution. With a little bit of configuration and some other discrete components connected to it according to the schematic diagram you will find below, you can be up and running in no time. It allows the Arduino to drive the slider control forward and backwards, enabling the opening and closing of the window.

      Power Supply

      Block diagram of a power supply system for the Automated window system using Arduino
      Block diagram of a power supply system for the Automated window system using Arduino

      The power supply provides the necessary power to the entire system, including the Arduino, sensors, and actuators. It’s important to choose a power supply that matches the voltage and current requirements of your components.

      Hi-link power supply
      Hi-link power supply

      The above block diagram shows the linear power supply breakdown that could be used for this project. You can used use a power supply module of your choice to achieve this. The system requires 5V to run and you can give the DC motor up to 12V. However, the higher the voltage, the faster it runs. To ensure the demonstration is observed, you can use a 5V supply that is packing a current rating of 2A or above. The Hi-Link power supply shown above is an intelligent power supply and can also serve. But it is pricey.

      Read Also DIY Non-Invasive Blood Pressure and Cholesterol Level Monitoring

      Circuit Diagram of Automated Window System With Arduino

      The Linear Power Supply Circuit Diagram

      linear power supply circuit diagram
      linear power supply circuit diagram

      Explanation of the Linear Power Supply Diagram

      The bridge rectifier, which is used to convert the ac supply to dc, receives this AC voltage that comes in from the step down transformer. The rectified voltage that emerges from the rectifier is a DC voltage that pulses and has a significant amount of ripple. However, we are looking for a pure DC waveform devoid of ripples, not something like this. Thus, a filter is applied.When the negative part of  diode D1 and negative part of diode D2 are connected together it gives a positive (+) AC input, while when  the positive part of diode D3 and positive part of diode D4 are connected together it gives a negative (-) AC input to the power supply unit.

      The pulsating DC voltage which still contains some AC voltage flows to the capacitor which is used to smoothing the ripples from the rectifier output. The capacitors used here is 1000µF and 0.1 µF respectively.

      In order to ensure that the ripple from the rectifier output is entirely rectified by obstructing any trace of AC that may have escaped the bridge rectifier during rectification, the power supply unit uses two capacitors, C1 and C2. The capacitor C1’s positive leg is connected to the positive side of the bridge rectifier, and its negative side is grounded. This circuit makes use of an LM7805 voltage regulator. The output of the LM7805 is 5V. Pin 2 of the voltage regulator is grounded, Pin 3 is linked to the positive of another capacitor, C2, (0.1µF), and Pin 1 of the voltage regulator is connected to the positive leg of C1 (1000µF). When the mains are powered on, current flows through the power supply circuit, the current that flows to the LM7805 regulator will give an output of 5V.

      Control Unit of the Automated Window system Project Design

      Arduino Standalone circuit diagram
      Arduino Standalone circuit diagram

      In other to further save cost, we had to build our own Arduino Uno using the Arduino Standalone version circuit diagram shown above. It is more or less an Arduino breakout board.

      The microcontroller, which serves as the project’s “brain,” is the control unit in the design. The project’s behavior or functionality is determined by the microcontroller, Atmega328P-PU, which was used. Because of the Arduino IDE’s exceptionally efficient code, the Atmel chip can operate with a lot less program memory than its larger competitors. They may be programmed to carry out a variety of tasks, including managing a generation line. As a result, the project is even more manageable and less tiresome. It has a lower price and a faster clock speed.

      Circuit Diagram of Automated Window System with Arduino
      Circuit Diagram of Automated Window System with Arduino

      The above schematic diagram shows the overall connection of the project design. We included a temperature sensor to check for the temperature and also a display module the 1602 LCD module to display the readings of the project design.

      Programming the Project Design

      #include <LiquidCrystal.h>
      
      //include the oneWire lib 
      #include <OneWire.h>
      //include the Dallas temp lib
      #include <DallasTemperature.h>
      
      // Data wire is plugged into pin 2 on the Arduino
      #define ONE_WIRE_BUS A1
      
        int windowForward = 10;
        int windowBackward = 13;
       
      
      int switch1 = 6;
      int switch2 = 7;
      
      //State the toxidity level
       int toxicLevel = 350;
      
      // analog pin 0 = sensor  i/p
      int rainSensePin= A0; 
      
      // current counter - goes up by 1 every second while sensing
      int curCounter= 0; 
      
      //declear the i/p for smoke detection
      int smokeSense = A2;
      
      // Setup a oneWire instance to communicate with any OneWire devices connected 
      OneWire oneWire(ONE_WIRE_BUS);
       
      // Pass our oneWire reference to Dallas Temperature.
      DallasTemperature sensors(&oneWire);
      // initialize the library by associating any needed LCD interface pin
      //state which pin of the LCD is connected
      LiquidCrystal lcd(12, 11, 5, 4, 3, 2);
      
      void setup(){
        Serial.begin(9600);
        sensors.begin();
        pinMode(windowForward, OUTPUT);
        pinMode(windowBackward, OUTPUT);
        pinMode(switch1, INPUT);
        pinMode(switch2, INPUT);
        lcd.begin(16, 2);
        // Display a welcome message
        lcd.setCursor(0, 0);
        lcd.print("AUTOMATIC WINDOW"); 
        delay(500);
        lcd.setCursor(0, 1);
        lcd.print(" CONTROL SYSTEM: ");
        delay(2000);
        lcd.setCursor(0, 0);
        lcd.print("1> RAIN-SENSING,"); 
        delay(1500);
        lcd.setCursor(0, 1);
        lcd.print("2> TEMP-SENSING,");
        delay(1000);
        lcd.setCursor(0, 0);
        lcd.print("2> TEMP-SENSING,");
        delay(1000);
        lcd.setCursor(0, 1);
        lcd.print("3> SMOKE-SENSING");
        delay(2000);
        lcd.setCursor(0, 0);
        lcd.print("  DESIGNED BY:  ");
        delay(1000);
        lcd.setCursor(0, 1);
        lcd.print("OMOLOLA  ADEMOLA");
        delay(2000);
        }
      
      void loop(){
      sensors.requestTemperatures(); 
      Serial.print("  Temperature is: ");
      Serial.print(sensors.getTempCByIndex(0));
      Serial.println("'C");
      float roomTemp = sensors.getTempCByIndex(0);
        lcd.setCursor(0, 0);
        lcd.print("ROOM TEMP:");
        lcd.setCursor(9, 0);
        lcd.print(roomTemp);
        lcd.setCursor(14, 0);
        lcd.print("'C");
        
      
      int rainSenseReading = analogRead(rainSensePin); 
      Serial.print("NOw rain ");
      Serial.println(rainSenseReading);
                                                 
      
      //begin reading from smoke sensor
      int readSmoke = analogRead(smokeSense);
      Serial.print(" Now Smokereading: ");
      Serial.println(readSmoke);
      delay(500);
      
        int sense1 = digitalRead(switch1);
        int sense2 = digitalRead(switch2);
        
         if( sense2 == LOW) {
         if ((rainSenseReading < 350) || (readSmoke >= 280)){ 
           digitalWrite(windowForward, HIGH);
          digitalWrite(windowBackward, LOW);
          delay(300);
          lcd.setCursor(0, 1);
          lcd.print("WINDOW      ");
          lcd.setCursor(7, 1);
          lcd.print("OPENED    ");
         }
         }
          else if( sense2 == HIGH){
          if ((rainSenseReading < 350) || (readSmoke >= 280)){
          digitalWrite(windowForward, LOW);
          digitalWrite(windowBackward, LOW);
          delay(300);
          
          }
           
         }
         
      
      if( sense1 == LOW) {
      if((roomTemp > 40.00) && (rainSenseReading > 350) && (readSmoke <= 280) )
      {
          digitalWrite(windowForward, LOW);
          digitalWrite(windowBackward, HIGH);
          delay(300);
          lcd.setCursor(0, 1);
          lcd.print("WINDOW      ");
          lcd.setCursor(8, 1);
          lcd.print("CLOSED    ");
          
        }
      }
      else if( sense1 == HIGH)
      {
        if((roomTemp > 40.00) && (rainSenseReading > 350) && (readSmoke <= 280))
        digitalWrite(windowForward, LOW);
        digitalWrite(windowBackward, LOW);
        delay(300);
      
      }
      }


      Explanation of Arduino Source Code

      The oneWire library (from the Maxim Company) was included from the source code at lines 1 and 2 so that the IDE could understand the remaining syntax. The DS18B20 can determine the temperature in Celsius and Fahrenheit scales, respectively, thanks to the special library called Dallas Temperature, which is located at line 3. This is accomplished with a unique built-in algorithm. Any other IC linked to the Bus or wire could potentially be accessed by the application thanks to line 10. not limited to Onewire ICs only. Line 13 instructs the DallasTemp lib to use its built-in algorithm to return the temperature findings by reading off signals from which ICs. The temperature sensor in this instance was identified as oneWire.

      At Line 15, the function setup started the sensor at line 18. To obtain a real time temperature reading, the sensing of the temperature has to be taken continuously; at 30 code line where it prints out the temperature in degree Celsius in the function loop, it repeats the codes continuously depending of the pause time known as delay.

      Testing and Calibration

      The project worked as programed and was tested when we dropped water on the top of the sensor, thereby simulating rainfall. Also we tested the gas sensors using burning paper, and this trigger the window to automatically close. All these while, we can measure and display the temperature of the surroundings of the project design on the LCD screen.

      Conclusion

      We have successfully designed and implemented the project design. We have tested and found it working within the scope of the design, and we could also recommend that anyone who wants to replicate the project could expand on the ideas perhaps by including other functionalities to it. However, if you were successful in building this project following this post, leave us a comment below.

      FAQs on DIY Home Safety: Create an Automated Window System with Arduino for Rain, Smoke, and Gas Protection

      1. How does the Arduino-based automated window system enhance home safety?

      The Arduino-based automated window system enhances home safety by automatically closing your windows when it detects rain, smoke, or harmful gases. This prevents potential hazards from entering your home, such as water damage, smoke inhalation, or exposure to toxic gases. Once the environment is safe, the system reopens the windows, ensuring that your home remains protected and well-ventilated.

      2. What are the main components needed for this DIY automated window system?

      The main components required for this DIY automated window system include an Arduino Uno microcontroller, a rain sensor to detect moisture, a smoke detector sensor to monitor for smoke inside the room, a gas sensor (such as the MQ-2) to detect harmful gases, actuators (like servos or motors) to open and close the window, a relay module to control the actuators, and a power supply to power the entire system.

      3. Can this automated window system be expanded to control multiple windows?

      Yes, this automated window system can be expanded to control multiple windows by adding additional sensors and actuators for each window. The Arduino can be programmed to monitor multiple sensor inputs and control multiple actuators simultaneously, allowing you to automate the operation of several windows throughout your home.

      4. How do I test the Arduino-based automated window system before installation?

      Before installing the system on a real window, it’s important to test it on a small scale. You can simulate different conditions such as rain, smoke, and harmful gases to see how the system responds. Ensure that the sensors detect the appropriate conditions and that the actuators correctly open and close the window. Adjust the code and calibrate the sensors if necessary to achieve reliable performance.

      5. What are the energy efficiency benefits of using this automated window system?

      The automated window system helps improve energy efficiency by maintaining a stable indoor temperature. When it detects rain, the system automatically closes the windows to prevent cold air from entering, reducing the need for heating. Similarly, by closing the windows during hazardous gas detection, it helps maintain air quality and reduces the load on air purification systems, contributing to overall energy savings.

    • IoT Cardiovascular Disease Detection and Prevention Project

      IoT Cardiovascular Disease Detection and Prevention Project

      Vascular Disease Detection and Prevention Project
      Vascular Disease Detection and Prevention Project: The flow chart diagram

      In today’s blog post, we will discussing how to design and construct a cardiovascular disease detection and prevention project. This project work uses some inexpensive modules to device an non-invasive technique to take body temperature readings, Electrocardiograph (ECG), pulse rate reading, and blood glucose reading, Cholesterol level and blood pressure.

      To design a non-invasive technique to detect and prevent these cardiovascular disease we needed to make sure we can read these health parameters effectively. As always said in science, we go from the known to the unknown.

      Introduction

      Cardiovascular Disease Detection and Prevention Project
      cardiovascular Disease types

      Cardiovascular diseases (CVDs) remain a leading cause of death globally, emphasizing the need for effective detection and prevention methods. Traditional monitoring systems, often invasive, can be uncomfortable and impractical for continuous monitoring. The advent of IoT (Internet of Things) and advancements in non-invasive technology have opened new avenues for real-time cardiovascular health monitoring. This blog post explores an exciting project that combines Arduino with non-invasive techniques to detect and prevent cardiovascular diseases

      In the digital age, health monitoring has evolved significantly, thanks to innovations in technology. Non-invasive monitoring techniques are at the forefront, offering a painless and convenient way to track vital signs. This blog post delves into an IoT-based project using Arduino, focusing on non-invasive detection of cardiovascular diseases. This system aims to provide real-time data on heart health, enabling early diagnosis and timely intervention.

      Understanding the Basics

      Non-Invasive Monitoring

      Non-Invasive Glucose and ECG levels Monitoring using Arduino: An ECG sensor for pregnancy
      Non-Invasive Glucose and ECG levels Monitoring using Arduino: An ECG sensor for pregnancy

      Non-invasive monitoring refers to techniques that do not require penetration of the skin or body cavities. These methods are less painful, reduce the risk of infection, and are generally more comfortable for continuous monitoring.

      Cardiovascular Disease Monitoring

      Cardiovascular diseases encompass a range of conditions affecting the heart and blood vessels, including hypertension, heart attacks, and strokes. Early detection and continuous monitoring are crucial for effective management and prevention.

      IoT Cardiovascular Disease and Prevention Project: Components Needed

      The Development Boards

      Arduino Uno and NodeMCU development board
      Arduino Uno and NodeMCU development board

      For this project, an Arduino Uno and a NodeMCU board. This choice was ideal due to its ease of use and extensive support community. Most of our sensors were DIY (Do-It-yourself) inexpensive sensor modules. Whereas, the ones we couldn’t get due to cost, we fabricated it using the techniques required for it.

      Sensors

      • ECG Sensor (AD8232): To monitor the heart’s electrical activity.
      • Pulse Sensor: To detect heart rate by measuring pulse waves.
      • Temperature Sensor (DS18B20 waterproof type): To monitor body temperature, a vital sign in heart disease diagnosis.
      • Photo Diode sensor: to detect the lights off the human specimen body.

      Additional Components

      ITEM DESCRIPTIONQUANTITY
      NodeMCU1
      JUMPER WIRES2 SETS
      RESISTORS6
      ARDUINO UNO1
      CASING1
      VERO BOARD1
      ECG SENSOR MODULE1
      SOLDER1
      CUSTOM CHOLESTEROL MODULE1
      2004 LCD MODULE1
      LiPo BATTERY CHARGER1
      LiPo BATTERY2
      LED1
      DS18B20 TEMPERATURE SENSOR1
      GLUE GUN1
      FEMALE HEADERPIN2
      RED SWITCH1
      MISCELLANEOUS 

      The table above shows the rest of the components and modules needed for this project design. The bill of materials talked about a custom cholesterol level detection module. This was designed by applying the Beer-Lambert technique using optical method of Infrared radiation and light absorption technology. You can read more here Non-Invasive Glucose and ECG levels Monitoring Arduino.

      How the Sensors Work

      Non-Invasive ECG Sensor

      Cardiovascular disease detection and prevention: The ECG sensor module
      Cardiovascular disease detection and prevention: The ECG sensor module

      The ECG sensor captures the electrical signals generated by the heart. It detects the PQRST waves, representing different phases of the cardiac cycle. These signals are crucial for diagnosing heart conditions.

      Non-Invasive Glucose and ECG levels Monitoring using Arduino: An ECG sensor module
      Non-Invasive ECG levels Monitoring using Arduino: An ECG sensor module

      This module made it very possible for us to read the electrocardiogram using the non-invasive approach for a very reduced cost implications. The sensor worked very well with the Arduino Uno board that was available for programming the sensor module itself.

      Non-Invasive Pulse Sensor

      Cardiovascular disease detection and prevention: The pulse sensor module
      Cardiovascular disease detection and prevention: The pulse sensor module

      The pulse sensor detects blood flow through the arteries, providing real-time heart rate data. It uses an LED and photodiode to measure the pulse by detecting changes in light intensity caused by blood flow.

      This module uses an oximeter to measure the pulse of the person’s pulse rate. The sensor measures the rate of oxygenated blood that flows through the fingers where the infrared sensor is placed. This is because the blood flow casts a shadow each time, the hearts pumps blood through the body.

      Non-Invasive Temperature Sensor

      Temperature sensors help monitor body temperature, a critical parameter in diagnosing heart-related conditions like fever or infection-induced heart strain. We used the DS18B20 temperature sensor, the waterproof type to take the precise body temperature. The temperature sensor is a factor that we need that is related to the glucose measurement.

      Non-Invasive Glucose Sensor

      Cardiovascular disease detection and prevention: The glucose sensor circuit diagram design
      The glucose sensor circuit diagram design

      The Glucose level of the was measured using the technique adopted by schematic diagram shown above. The setup diagram was drawn on fritzing IDE, the breadboard version. Here we used the types of LED for the design and  a photocell to represent the emitters of different spectrum of light needed and the sensor that would detect the reflected light through the human skin respectively. According to Beer-Lambert’s law.

      The Beer-Lambert's Law expression
      The Beer-Lambert’s Law expression

      According to the Beer-Lambert’s law, as infrared light passes through the material, the intensity of light exponentially decays because it is absorbed by molecules of material. Thus based on Beer-Lambert’s law, a single wavelength is selected for glucose concentration evaluation and by using absorption theory glucose level is predicted.

      Non-Invasive Cholesterol Sensor

      The Glucose sensor configuration
      The Cholesterol sensor configuration

      To measure the cholesterol level, the laser and the photocell was added to the circuit as shown in fig 4.15 above. Using the methodology stated above, We used the Arduino code snippet to determine the cholesterol level.

      Non-Invasive Blood Pressure Sensor

      The Blood pressure chart
      The Blood pressure chart

      To design the blood pressure for the person using a non-invasive method, We adopted the approach presented in this paper that shows the relationship between Electrocardiographic changes and blood pressure. According to the publication,  Elevated blood pressure induces electrocardiographic changes and is associated with an increase in cardiovascular disease later in life compared to normal blood pressure levels.

      A library DFRobot_ECG was created that made life easier. It allowed us to use the temperature readings and call some function that would produce the BP based on the calculations and formula shown in chapter 3.  We converted the read ECG valued to BP by calling these functions and also summing the SBP and DBP together and dividing by 3 as shown in code line 43.

      You May Also Like…

      Circuit Design and Connections

      Cardiovascular disease detection and prevention: The circuit diagram design
      Cardiovascular disease detection and prevention: The circuit diagram design

      Explanation of Wiring Diagram

      1. ECG Sensor: Connect the sensor’s output pin to Arduino analog pin A0. Connect the ground to GND and VCC to 5V.
      2. Pulse Sensor: Connect the pulse sensor’s signal pin to analog pin A1. Connect the ground to GND and VCC to 5V.
      3. Temperature Sensor: Connect the DS18B20 sensor’s output pin to analog pin D2. Connect VCC to 5V and ground to GND.

      Assembly Steps

      Cardiovascular disease detection and prevention: The circuit diagram design
      Cardiovascular disease detection and prevention: The circuit diagram design
      1. Connect all sensors to the Arduino using the breadboard and jumper wires.
      2. Ensure proper grounding and power supply connections.
      3. Connect the Wi-Fi module to the Arduino (using the appropriate pins for TX/RX communication).

      Programming the Arduino

      #include <EEPROM.h>
      #include <SoftwareSerial.h>
      #include <DallasTemperature.h>
      #include <OneWire.h>
      #include <LiquidCrystal.h>
      
      SoftwareSerial mySerial(2, 3); // RX, TX
      int sensor[] = {};
      
      //4 pin of uno
      #define ONE_WIRE_BUS 4                          
      
      OneWire oneWire(ONE_WIRE_BUS);
       
      DallasTemperature sensors(&oneWire);            // Pass the oneWire reference to Dallas Temperature.
      
      LiquidCrystal lcd(12, 11, 10, 9, 8, 7);
      
      #define greenLED  13
      #define redLED  A4
      #define blueLED A5
      
      long randNumber;
      
      float temp, bp, chloe1, chloe2, totalChlr;
      int ecg1, ecg, pulseRate, glocoseSensor; //chekRandNumber; 
       int changeTemp;
      
      
      void generate(){
        randNumber = random(5, 10);
        Serial.println(randNumber);
       EEPROM.write(0, randNumber);
      }
      
      void setup(void){
        Serial.begin(115200); 
        while (!Serial) { ; }
        // set the data rate for the SoftwareSerial port
        mySerial.begin(115200);
        //mySerial.println("Hello, world?");
        sensors.begin();
        lcd.begin(20,4);
        //define the pins for ECG sensor
        pinMode(6, INPUT); // Setup for leads off detection LO +
        pinMode(5, INPUT); // Setup for leads off detection LO -
      
        //the LEDs
        pinMode(greenLED, OUTPUT);
        pinMode(redLED, OUTPUT);
        pinMode(blueLED, OUTPUT);
      
        //print a welcome message
        lcd.setCursor(0, 0);
        lcd.print("      WELCOME   ");
        lcd.setCursor(0, 1);
        lcd.print("  Mr. Ameh Solomon");
        for(int x=0; x<19; x++){
         lcd.setCursor(x,2);
        lcd.print("*");
        delay(200);
        }
        for(int x=0; x<19; x++){
         lcd.setCursor(x,3);
        lcd.print("*");
        delay(200);
        }
        lcd.clear();
        lcd.setCursor(0, 0);
        lcd.print(" IoT Based Vascular");
        lcd.setCursor(0,1);
        lcd.print("   Blood Disease");
        lcd.setCursor(0,2);
        lcd.print("   Prevention And");
        lcd.setCursor(0, 3);
        lcd.print(" Detection Project");
        delay(4000);
        lcd.setCursor(0,0);
        lcd.print("Prepping Sensors");
        for(int x=16; x<19; x++){
         lcd.setCursor(x,0);
        lcd.print("*");
        delay(200);
        }
        for(int x=0; x<19; x++){
         lcd.setCursor(x,1);
        lcd.print("*");
        delay(200);
        }
        for(int x=0; x<19; x++){
         lcd.setCursor(x,2);
        lcd.print("*");
        delay(200);
        }
        for(int x=0; x<19; x++){
         lcd.setCursor(x,3);
        lcd.print("*");
        delay(200);
        }
        lcd.clear();
      
        randomSeed(analogRead(A3));
      
        generate();
      }


      float bodyTemp(){
        // Send the command to get temperatures  
        sensors.requestTemperatures();                
        Serial.println("Temperature is: ");
        // Why "byIndex"? You can have more than one IC on the same bus. 0 refers to the first IC on the wire
        temp = sensors.getTempCByIndex(0);
        
        
        return temp;
       
      }
      
      
      int ecgSensor(){
         ecg1 = analogRead(A0);
        if((digitalRead(5) == 1)||(digitalRead(6) == 1)){
      Serial.println('!');
      }
      else{
        return ecg1;
      }
      //Wait for a bit to keep serial data from saturating
      delay(100);
      }
      
      
      To get the rest of this code, let us know by sending us a message
      

      Programming the NodeMCU

       #include "ThingSpeak.h"
      #include <ESP8266WiFi.h>
      #include <SoftwareSerial.h>
      
      SoftwareSerial nodeMCU(D1, D2);
      
      char ssid[] = "AncII";   // your network SSID (name) 
      char pass[] = "eureka26";   // your network password
      
      int keyIndex = 0;            // your network key Index number (needed only for WEP)
      
      WiFiClient  client;
       unsigned long myChannelNumber = 1685425;
      const char * myWriteAPIKey = "IWGFF3L5SEHT38RB";
      
      String myStatus = "field1 equals field2";
      
      const int ledPin =  LED_BUILTIN;// the number of the LED pin
      
      // Variables will change:
      int ledState = LOW;             // ledState used to set the LED
      
      // Generally, you should use "unsigned long" for variables that hold time
      // The value will quickly become too large for an int to store
      unsigned long previousMillis = 0;        // will store last time LED was updated
      
      // constants won't change:
      const long interval = 1000; 
      
      char c;
      String dataIn;
      int8_t indexOfA, indexOfB,indexOfC,indexOfD,
             indexOfE,indexOfF,indexOfG,indexOfH; 
      
      String data1, data2, data3, data4, data5, data6,
             data7, data8;
      
      
      void setup() {
      Serial.begin(115200);
      nodeMCU.begin(115200);
      
      pinMode(ledPin, OUTPUT);
      
      WiFi.mode(WIFI_STA); 
        ThingSpeak.begin(client);  // Initialize ThingSpeak
      }
      
      
      void blinkLed(){
        unsigned long currentMillis = millis();
      
        if (currentMillis - previousMillis >= interval) {
          // save the last time you blinked the LED
          previousMillis = currentMillis;
      
          // if the LED is off turn it on and vice-versa:
          if (ledState == LOW) {
            ledState = HIGH;
          } else {
            ledState = LOW;
          }
      
          // set the LED with the ledState of the variable:
          digitalWrite(ledPin, ledState);
        }
      }


      void loop(){
      while(nodeMCU.available() >0){
        c = nodeMCU.read();
       
         if( c == '\n'){
          break;
        }
      
        else{
          dataIn += c;
        }
      }
      
      if(c == '\n'){
        //Serial.println(c);
        parse_data();
      
      
        //thingspeak send
          if(WiFi.status() != WL_CONNECTED){
          Serial.print("Attempting to connect to SSID: ");
          Serial.println(ssid);
          while(WiFi.status() != WL_CONNECTED){
            WiFi.begin(ssid, pass);  // Connect to WPA/WPA2 network. Change this line if using open or WEP network
            Serial.print(".");
            delay(5000);
        } 
          Serial.println("\nConnected.");
        }
      
        else{
          blinkLed();
        }
      
        // set the fields with the values
        ThingSpeak.setField(1, data1);
        ThingSpeak.setField(2, data2);
        ThingSpeak.setField(3, data3);
        ThingSpeak.setField(4, data4);
        ThingSpeak.setField(5, data5);
        ThingSpeak.setField(6, data6);
        ThingSpeak.setField(7, data7);
        ThingSpeak.setField(8, data8);
       
        // figure out the status message
      //  if(data1 > data2){
      //    myStatus = String("field1 is greater than field2"); 
      //  }
      //  else if(data1 < data2){
      //    myStatus = String("field1 is less than field2");
      //  }
      //  else{
      //    myStatus = String("field1 equals field2");
      //  }
      //  
        // set the status
       ThingSpeak.setStatus(myStatus);
        
        // write to the ThingSpeak channel
        int x = ThingSpeak.writeFields(myChannelNumber, myWriteAPIKey);
        if(x == 200){
          Serial.println("Channel update successful.");
        }
        else{
          Serial.println("Problem updating channel. HTTP error code " + String(x));
        }
        
        // change the values
      //  data1++;
      //  if(data1 > 999){
      //    data1 = 0;
      //  }
      
          Serial.println("data 1= " + data1);
        Serial.println("data 2= " + data2);
        Serial.println("data 3= " + data3);
        Serial.println("data 4= " + data4);
        Serial.println("data 5= " + data5);
        Serial.println("data 6= " + data6);
        Serial.println("data 7= " + data7);
        Serial.println("data 8= " + data8);
        Serial.println("............................");
        
        delay(20000); // Wait 20 seconds to update the channel again
        
        c = 0;
        dataIn = "";
        }
        
      }
      
      
      void parse_data(){
        indexOfA = dataIn.indexOf("A");
        indexOfB = dataIn.indexOf("B");
        indexOfC = dataIn.indexOf("C");
        indexOfD = dataIn.indexOf("D");
        indexOfE = dataIn.indexOf("E");
        indexOfF = dataIn.indexOf("F");
        indexOfG = dataIn.indexOf("G");
        indexOfH = dataIn.indexOf("H");
      
        data1 = dataIn.substring(0, indexOfA);
        data2 = dataIn.substring(indexOfA+1, indexOfB);
        data3 = dataIn.substring(indexOfB+1, indexOfC);
        data4 = dataIn.substring(indexOfC+1, indexOfD);
      
        data5 = dataIn.substring(indexOfD+1, indexOfE);
        data6 = dataIn.substring(indexOfE+1, indexOfF);
        data7 = dataIn.substring(indexOfF+1, indexOfG);
        data8 = dataIn.substring(indexOfG+1, indexOfH);
        
      }


      Explanation of Source Code

      This code connects an ESP8266 WiFi module (NodeMCU) to the internet and sends data to a website called ThingSpeak.

      Here’s a breakdown of the functionality in 3 parts:

      1. Setup:
        • It first establishes serial communication for debugging messages and sets up the NodeMCU to communicate at a specific baud rate.
        • It configures a pin as an output to control an LED.
        • It connects the ESP8266 to your WiFi network using the provided credentials.
        • Finally, it initializes the ThingSpeak library to communicate with the ThingSpeak website.
      2. Main Loop:
        • This loop runs continuously.
        • It constantly checks for incoming data on the serial port from the NodeMCU.
        • If data is available, it reads it character by character until it encounters a newline character (“\n”).
        • Once a complete line is received, it calls the parse_data function to extract eight data values separated by specific characters (likely letters A to H).
        • It then checks the WiFi connection status. If not connected, it attempts to connect using the provided credentials. If connected, it blinks an LED and sends the extracted data to ThingSpeak using the ThingSpeak library functions.
        • After sending the data, it prints the received data values to the serial monitor for debugging purposes.
        • Finally, it delays for 20 seconds before repeating the loop.
      3. Data Parsing:
        • This function takes the received data string as input and searches for specific characters (A-H) within the string.
        • It uses the indexOf function to find the positions of these characters.
        • Based on these positions, it extracts eight substrings from the original data string using the substring function. These eight substrings are assigned to variables data1 to data8.

      Data Processing and Display

      Cardiovascular disease detection and prevention design

      Visualization

      • LCD Display: Shows real-time ECG, pulse, and temperature data.
      • It also measures and displays the ECG levels, as well as the Glucose levels
      • The LCD screen also displays the total Cholesterol level measured by the design.
      • Serial Monitor: We used the serial monitor and serial graph for debugging and data analysis.

      IoT Integration

      The thingspeak IoT platform display
      The thingspeak IoT platform display

      We used the NodeMCU board to use its Wi-Fi capability to send data to a cloud server of thingspeak. This would allow us to view and monitor the reading remotely using HTTP protocol.

      Calibration and Testing

      testing the sensors
      testing the sensors

      Sensor Calibration

      We ensured the sensor is properly placed on the skin to get accurate readings. and we place the pulse sensor and glucose sensor on a fingertip for best results. Using the temperature sensor DS18B20, we didn’t need to much, its result was very closer to known clinical thermometer reading we had earlier.

      Testing

      Traditional glucose measurement
      Traditional glucose measurement
      • Initial Testing: Before we began this project, we had to take clinical reading of a person whom we termed Speciment A. We got the results of this test subject and got the Glucose, cholesterol, temperature, ECG, blood pressure data. And we were able to verify our own non-invasive readings on the LCD and Serial Monitor against these.
      Cardiovascular disease detection and prevention design: Blood work samples for lab test
      Cardiovascular disease detection and prevention design: Blood work samples for lab test
      • Field Testing: We tested the system in different environments to ensure reliability.

      Challenges and Limitations

      Accuracy and Noise

      • ECG Signal Quality: Noise and artifacts can interfere with ECG readings. Use filters and signal processing techniques to enhance signal quality.
      • Pulse Detection: Ensure the pulse sensor is correctly positioned to avoid false readings.

      Conclusion

      The IoT-based cardiovascular disease detection and prevention project using Arduino and non-invasive techniques is a groundbreaking approach to heart health monitoring. By leveraging modern technology, this system promises to enhance the early detection and prevention of cardiovascular diseases, making health monitoring more accessible and efficient. As technology continues to evolve, the integration of IoT and non-invasive techniques will undoubtedly play a pivotal role in transforming healthcare.

      FAQs

      1. How accurate are non-invasive glucose sensors?
        • Non-invasive glucose sensors are continuously improving. While they are not yet as accurate as traditional methods, they offer significant convenience and comfort.
      2. Can I use any Arduino board for this project?
        • Yes, but Arduino Uno or Mega are recommended for their ease of use and extensive community support.
      3. What are the best sensors for beginners in this project?
        • The AD8232 ECG sensor and the Pulse Sensor are excellent choices for beginners due to their simplicity and reliability.
      4. How can I improve the accuracy of my ECG readings?
        • Use noise filters, proper electrode placement, and consider signal amplification to enhance the accuracy of ECG readings.
      5. What are the safety considerations when working with ECG sensors?
        • Ensure proper insulation and grounding to avoid electrical shock. Always follow safety guidelines when handling electrical components.
    • IoT Pump Control for Efficient Irrigation Systems

      IoT Pump Control for Efficient Irrigation Systems

      The project design IoT based pump control irrigation system system using ESP32 Arduino focus on building an irrigation system model that checks on model sensors like temperature, soil moisture content, reservoir/tank water level, and displays this on an Blynk Internet of Things (IoT) dashboard. The model project design automatically irrigates the soil when the water level content is low, it also has an controls on the IoT dashboard where a user can pump water into the reservoir tank by will. The design also sends an alert when any of the monitoring parameter are off. Let us go step-by-step to know how this IoT based pump control irrigation system using ESP32 Arduino was built. Ensure you read until the end.

      IoT based pump control irrigation  system using ESP32 Arduino
      IoT based pump control irrigation system using ESP32 Arduino: The Blynk Desktop IoT Dashboard

      IoT based pump control irrigation system using ESP32 Arduino: Components and Materials Needed

      S/NITEMSQUANTITY
      1ESP32 DEV BOARD  1
      2DC PUMP2  
      3TRANSISTOR2
      4PLASTIC CONTAINER2
      5USB POWER JACK1
      6MODEL FARM1
      7ULTRASONIC DISTANCE SENSOR1
      8PLASTIC CASING1
      9VERO BOARD1
      10CONNECTING WIRES3
      11PROGRAMMING AND LIBRARIES UPLOAD1
      12GLUE STICKS2
      13SOLDERING LEAD1
      14SOLDERING IRON1
      15SOIL MOISTURE SENSOR1
      165V DC PUMP2
       HEADER PIN1
      18MISCELLENOUS 

      The ESP32 development (dev) board was used because of its fantatic features. It came with lot of processing power,  having two 32 bit cores, and enough memory. It possessed both Bluetooth and WiFi capability on its chip. And it could be programmed to enter low-power deep sleep .

      ESP32 Dev board
      ESP32 Dev board

      Specifications:

      • The ESP32 possess dual core (meaning it 2 processors).
      • It possess Wi-Fi built-in capability.
      • It possessed Bluetooth capability.
      • It can run 32 bit programs
      • Clock frequency up to 240MHz
      • It has 512 Kb Random Access Memory (RAM)
      • It has 30 pins with 15 on each sides.
      • It has other peripheral features like capacitive touch, ADCs, DACs, UART, SPI, I2C and much more.

      The Perforated boards (perf boards or Veroboard) is a plastic perforated insulator used to arrange configurations of electronic design to finished work. At first, our project was first modelled on a Breadboard, which is a detachable platform, which gives room for error making, removing of components and reattachment of the components. Unlike the Breadboard, the perfboard, is used to solder these components together and once done, is usually very difficult to remove them without applying heat or destroying the components by the use of force.

      The Schematic Diagram

      The circuit diagram for IoT based pump control irrigation  system using ESP32 Arduino
      The circuit diagram for IoT based pump control irrigation system using ESP32 Arduino

      The Explanation

      The pictorial schematic diagram above shows how the entire circuitry was assembled. This circuit diagram was drawn using Fritzing IDE. The above circuit is the breadboard view section. As shown the whole design was dependent on the ESP32 dev board. The Ultrasonic sensor was connected to the MCU using two wire data method. The trigger (trig) pin was connected to the digital pin 13 and the echo pin of the ultrasonic sensor was connected to the digital pin 12. The power rails of the ultrasonic sensor was connected to the 5V and the GND pins respectively. This is in parallel to the power rail from which the ESP32 dev board was powered from too.

      The circuit diagram for IoT based pump control irrigation system using ESP32 Arduino
      The circuit diagram for IoT based pump control irrigation system using ESP32 Arduino

      As shown in the schematic diagram above, the two DC pumps were used for different purposes. One of the DC pump served for irrigation, while the other one was to ensure that there is enough water in the reservoir tank for irrigation. Since the DC pumps don’t drag so much current, we used a pair of NPN transistors to construct a common emitter follower which we used to turn on the DC pumps when needed and turn them off when we needed them to stay turned off.

      Modelling and Construction of the IoT based pump control irrigation system using ESP32 Arduino

      plastic enclosure for the circuitry design
      plastic enclosure for the circuitry design

      The casing was done using a white plastic box of dimension 3×3”. It was suitable to house the components and wiring. The power supply plug was connected and powered on to testing the design working properly.

      The wrapped box served as enclosure for circuit board
      The wrapped box served as enclosure for circuit board

      This later wrapped with a blue polyethylene material and it housed the veroboard that has the microcontroller and socket header for the other components as shown in figure above.

      Modelling the Irrigation Garden

      Irrigation garden model
      Irrigation garden model

      This involved the prototyping of the farm to be irrigated, the water storage tank and the river or waterbody to be demonstrated with. To model the whole project, a wooden platform was constructed containing two wooden boxes. The box for the model farm was done using a dimensions of 30cm × 15cm × 10cm. while the box for housing the reservoirs was 20cm × 11cm × 10cm.

      The box casing holding the two reservoirs
      The box casing holding the two reservoirs

      The construction of the IoT based pump control irrigation system using ESP32 Arduino was done using soldering and coupling of active circuit. The soldering was done on the VERO Board using a 60 watts soldering, the components were properly arranged by following the designed circuit diagram of the project. 

      Programming the Project Design

       // See the Device Info tab, or Template settings
      #define BLYNK_TEMPLATE_ID "TMPLYH5GKVJ9"
      #define BLYNK_DEVICE_NAME "IoT Based Water Pump Control"
      #define BLYNK_AUTH_TOKEN "9UNYu0-4YQSM5BGvY0pFavvxJ-VdTLff"
      
      
      // Comment this out to disable prints and save space
      #define BLYNK_PRINT Serial
      
      
      #include <WiFi.h>
      #include <WiFiClient.h>
      #include <BlynkSimpleEsp32.h>
      
      char auth[] = BLYNK_AUTH_TOKEN;
      
      // Your WiFi credentials.
      // Set password to "" for open networks.
      char ssid[] = "AncII";
      char pass[] = "eureka26";
      
      long duration;
      float cm, distance;
      int toggleState_1, toggleState_2;
       int soilWaterLevel;
      
      #define trigPin 13
      #define echoPin 12
      #define RelayPin1 32
      #define RelayPin2 33 
      
      
      BLYNK_CONNECTED() {
        // Request the latest state from the server
        Blynk.syncVirtual(V0);
        Blynk.syncVirtual(V1);
        Blynk.syncVirtual(V2);
        Blynk.syncVirtual(V3);
      }
      
      
      void setup(){
        // Debug console
        Serial.begin(115200);
         pinMode(trigPin, OUTPUT);
         pinMode(echoPin, INPUT);
         pinMode(RelayPin1, OUTPUT);
         pinMode(RelayPin2, OUTPUT);
         
        Blynk.begin(auth, ssid, pass);
        // You can also specify server:
        //Blynk.begin(auth, ssid, pass, "blynk.cloud", 80);
        //Blynk.begin(auth, ssid, pass, IPAddress(192,168,1,100), 8080);
      }
      
      
      float uSensor(float numfactor, float denumFactor){
        digitalWrite(trigPin, LOW);
        delayMicroseconds(2);
        digitalWrite(trigPin, HIGH);
        delayMicroseconds(10);
        digitalWrite(trigPin, LOW);
        duration = pulseIn(echoPin, HIGH);
        distance = duration * (numfactor/denumFactor);
        distance = map(distance, 2.00, 18.20, 100.00, 0.00);
      
        
        if((distance >= 94)&&(distance < 100)){
         digitalWrite(RelayPin1, LOW);
         Serial.println("water stopped pumping into Irrigation Tank");
        }
      
        else{
          Serial.println("ariba");
        }
      
        Serial.print("Tank Water Level: ");
       Serial.println(distance);
        return distance;
      }
      
      int soilMoistureLevel(int sensorPin){
       soilWaterLevel = analogRead(sensorPin);
       soilWaterLevel = map(soilWaterLevel, 0, 4095, 100, 0);
       soilWaterLevel = map(soilWaterLevel, 0, 71, 0, 100);
       Serial.print("Soil Moiture Level: ");
       Serial.println(soilWaterLevel);
      
      if(soilWaterLevel <= 40){
       Serial.println("soil needs water");
      }
      
      
      if((soilWaterLevel >= 87) && (soilWaterLevel <= 99)){
        digitalWrite(RelayPin2, LOW);
      }
       return  soilWaterLevel;
       
      }
      
      
      void sendSensor(){
        Blynk.virtualWrite(V3, soilWaterLevel);
        Blynk.virtualWrite(V2, distance);
        
       }
      
      
      BLYNK_WRITE(V0) {
        toggleState_1 = param.asInt();
       if(distance <= 92.00){ 
        if(toggleState_1 == 0){
          digitalWrite(RelayPin1, LOW);
        }
        else { 
          digitalWrite(RelayPin1, HIGH);
        }
      }
      }
      
      
      BLYNK_WRITE(V1) {
        toggleState_2 = param.asInt();
      
       if(soilWaterLevel <  88  ){
        if(toggleState_2 == 0){
          digitalWrite(RelayPin2, LOW);
        }
        else { 
          digitalWrite(RelayPin2, HIGH);
        } 
      
      }
      }
      
      
      void loop(){
        uSensor(0.034, 2.0);
        soilMoistureLevel(34);
        sendSensor();
      //  BLYNK_WRITE(V1);
      //  BLYNK_WRITE(V2);
        
        Blynk.run();
       
      }


      Explanation of Arduino Source Code

      Code line is 57 and 58 where we defined the place where the trig pin and the echo pin were connected to the esp32 development board respectively. Code line 22 and 23  created variables that would allow the Ultrasonic sensor to measure distance in inches and centimeter.

      In the setup() function, we set these pinouts of the ultrasonic sensor (U.sensor) as input for the echo pin  and output for the trig pin.

       We created a custom function that was designated to measuring distance in centimetres using the U.sensor. this function was called. … in this function we the echo pin for some time then pulse input the trig using the pulseIn function. We calculated the distance measurement away from any obstacle which is hit by the sonar wave sent by the sensor transmitter and then echoed back to it and recieved by its receiver. The measure distance is then converted to centimetres (cm) using the formula shown in code line. The result is printed out on serial monitor using the syntax

      Designing and Setting Up the Blynk IoT Dashboard

      IoT based pump control irrigation system using ESP32 Arduino
      IoT based pump control irrigation system using ESP32 Arduino: The Blynk Desktop IoT Dashboard

      To begin the setting up of the Blynk dashboard, go to the Blynk platform and after creating an account. Login into your blynk dashboard and click on the “Developer zone”. There you can create a new template.

      IoT based pump control irrigation  system using ESP32 Arduino: Setting up the IoT dashboard
      IoT based pump control irrigation system using ESP32 Arduino: Setting up the IoT dashboard

      After naming your template, you get to set up Datastreams, Web Dashboard, Automations and Events.

      Results and Testing of the Design

      Arduino sketch for IoT water pump

      This was a custom function called soilMoistureLevel. In the function the MCU pin where the resistive soil moisture sensor was connected was read using the analog function analogRead(). This was then mapped from the 16-bit to a percentage level. However, this was found to be on 71. And so it led to another mapping of 0 to 100%. The serial print function was used to print the measure soil moisture content on the serial monitor.

      An if statement was used to check then when the soil water level was low below or equivalent to 40% so that it could print “soil needs water’. And if the soil moisture level was abundant between the range of 87 to 99 %, it will turn off the relay pin that was responsible for pumping water into the model garden farm this is shown in code line 95.

      Conclusion

      The system design has been done successfully and it can automatically measure the soil moisture content in the model garden and check if there is enough water in the reservoir tank to irrigate the model garden. It can also alert the user when there is change in the parameters being monitored.

      Read More

    • IoT Pump Control Irrigation System Using ESP32 Arduino

      IoT Pump Control Irrigation System Using ESP32 Arduino

      The project design IoT based pump control irrigation system system using ESP32 Arduino focus on building an irrigation system model that checks on model sensors like temperature, soil moisture content, reservoir/tank water level, and displays this on an Blynk Internet of Things (IoT) dashboard. The model project design automatically irrigates the soil when the water level content is low, it also has an controls on the IoT dashboard where a user can pump water into the reservoir tank by will. The design also sends an alert when any of the monitoring parameter are off. Let us go step-by-step to know how this IoT based pump control irrigation system using ESP32 Arduino was built. Ensure you read until the end.

      IoT based pump control irrigation  system using ESP32 Arduino
      IoT based pump control irrigation system using ESP32 Arduino: The Blynk Desktop IoT Dashboard

      IoT based pump control irrigation system using ESP32 Arduino: Components and Materials Needed

      S/NITEMSQUANTITY
      1ESP32 DEV BOARD  1
      2DC PUMP2  
      3TRANSISTOR2
      4PLASTIC CONTAINER2
      5USB POWER JACK1
      6MODEL FARM1
      7ULTRASONIC DISTANCE SENSOR1
      8PLASTIC CASING1
      9VERO BOARD1
      10CONNECTING WIRES3
      11PROGRAMMING AND LIBRARIES UPLOAD1
      12GLUE STICKS2
      13SOLDERING LEAD1
      14SOLDERING IRON1
      15SOIL MOISTURE SENSOR1
      165V DC PUMP2
       HEADER PIN1
      18MISCELLENOUS 

      The ESP32 development (dev) board was used because of its fantatic features. It came with lot of processing power,  having two 32 bit cores, and enough memory. It possessed both Bluetooth and WiFi capability on its chip. And it could be programmed to enter low-power deep sleep .

      ESP32 Dev board
      ESP32 Dev board

      Specifications:

      • The ESP32 possess dual core (meaning it 2 processors).
      • It possess Wi-Fi built-in capability.
      • It possessed Bluetooth capability.
      • It can run 32 bit programs
      • Clock frequency up to 240MHz
      • It has 512 Kb Random Access Memory (RAM)
      • It has 30 pins with 15 on each sides.
      • It has other peripheral features like capacitive touch, ADCs, DACs, UART, SPI, I2C and much more.

      The Perforated boards (perf boards or Veroboard) is a plastic perforated insulator used to arrange configurations of electronic design to finished work. At first, our project was first modelled on a Breadboard, which is a detachable platform, which gives room for error making, removing of components and reattachment of the components. Unlike the Breadboard, the perfboard, is used to solder these components together and once done, is usually very difficult to remove them without applying heat or destroying the components by the use of force.

      The Schematic Diagram

      The circuit diagram for IoT based pump control irrigation  system using ESP32 Arduino
      The circuit diagram for IoT based pump control irrigation system using ESP32 Arduino

      The Explanation

      The pictorial schematic diagram above shows how the entire circuitry was assembled. This circuit diagram was drawn using Fritzing IDE. The above circuit is the breadboard view section. As shown the whole design was dependent on the ESP32 dev board. The Ultrasonic sensor was connected to the MCU using two wire data method. The trigger (trig) pin was connected to the digital pin 13 and the echo pin of the ultrasonic sensor was connected to the digital pin 12. The power rails of the ultrasonic sensor was connected to the 5V and the GND pins respectively. This is in parallel to the power rail from which the ESP32 dev board was powered from too.

      The circuit diagram for IoT based pump control irrigation system using ESP32 Arduino
      The circuit diagram for IoT based pump control irrigation system using ESP32 Arduino

      As shown in the schematic diagram above, the two DC pumps were used for different purposes. One of the DC pump served for irrigation, while the other one was to ensure that there is enough water in the reservoir tank for irrigation. Since the DC pumps don’t drag so much current, we used a pair of NPN transistors to construct a common emitter follower which we used to turn on the DC pumps when needed and turn them off when we needed them to stay turned off.

      Modelling and Construction of the IoT based pump control irrigation system using ESP32 Arduino

      plastic enclosure for the circuitry design
      plastic enclosure for the circuitry design

      The casing was done using a white plastic box of dimension 3×3”. It was suitable to house the components and wiring. The power supply plug was connected and powered on to testing the design working properly.

      The wrapped box served as enclosure for circuit board
      The wrapped box served as enclosure for circuit board

      This later wrapped with a blue polyethylene material and it housed the veroboard that has the microcontroller and socket header for the other components as shown in figure above.

      Modelling the Irrigation Garden

      Irrigation garden model
      Irrigation garden model

      This involved the prototyping of the farm to be irrigated, the water storage tank and the river or waterbody to be demonstrated with. To model the whole project, a wooden platform was constructed containing two wooden boxes. The box for the model farm was done using a dimensions of 30cm × 15cm × 10cm. while the box for housing the reservoirs was 20cm × 11cm × 10cm.

      The box casing holding the two reservoirs
      The box casing holding the two reservoirs

      The construction of the IoT based pump control irrigation system using ESP32 Arduino was done using soldering and coupling of active circuit. The soldering was done on the VERO Board using a 60 watts soldering, the components were properly arranged by following the designed circuit diagram of the project. 

      Programming the Project Design

       // See the Device Info tab, or Template settings
      #define BLYNK_TEMPLATE_ID "TMPLYH5GKVJ9"
      #define BLYNK_DEVICE_NAME "IoT Based Water Pump Control"
      #define BLYNK_AUTH_TOKEN "9UNYu0-4YQSM5BGvY0pFavvxJ-VdTLff"
      
      
      // Comment this out to disable prints and save space
      #define BLYNK_PRINT Serial
      
      
      #include <WiFi.h>
      #include <WiFiClient.h>
      #include <BlynkSimpleEsp32.h>
      
      char auth[] = BLYNK_AUTH_TOKEN;
      
      // Your WiFi credentials.
      // Set password to "" for open networks.
      char ssid[] = "AncII";
      char pass[] = "eureka26";
      
      long duration;
      float cm, distance;
      int toggleState_1, toggleState_2;
       int soilWaterLevel;
      
      #define trigPin 13
      #define echoPin 12
      #define RelayPin1 32
      #define RelayPin2 33 
      
      
      BLYNK_CONNECTED() {
        // Request the latest state from the server
        Blynk.syncVirtual(V0);
        Blynk.syncVirtual(V1);
        Blynk.syncVirtual(V2);
        Blynk.syncVirtual(V3);
      }
      
      
      void setup(){
        // Debug console
        Serial.begin(115200);
         pinMode(trigPin, OUTPUT);
         pinMode(echoPin, INPUT);
         pinMode(RelayPin1, OUTPUT);
         pinMode(RelayPin2, OUTPUT);
         
        Blynk.begin(auth, ssid, pass);
        // You can also specify server:
        //Blynk.begin(auth, ssid, pass, "blynk.cloud", 80);
        //Blynk.begin(auth, ssid, pass, IPAddress(192,168,1,100), 8080);
      }
      
      
      float uSensor(float numfactor, float denumFactor){
        digitalWrite(trigPin, LOW);
        delayMicroseconds(2);
        digitalWrite(trigPin, HIGH);
        delayMicroseconds(10);
        digitalWrite(trigPin, LOW);
        duration = pulseIn(echoPin, HIGH);
        distance = duration * (numfactor/denumFactor);
        distance = map(distance, 2.00, 18.20, 100.00, 0.00);
      
        
        if((distance >= 94)&&(distance < 100)){
         digitalWrite(RelayPin1, LOW);
         Serial.println("water stopped pumping into Irrigation Tank");
        }
      
        else{
          Serial.println("ariba");
        }
      
        Serial.print("Tank Water Level: ");
       Serial.println(distance);
        return distance;
      }
      
      int soilMoistureLevel(int sensorPin){
       soilWaterLevel = analogRead(sensorPin);
       soilWaterLevel = map(soilWaterLevel, 0, 4095, 100, 0);
       soilWaterLevel = map(soilWaterLevel, 0, 71, 0, 100);
       Serial.print("Soil Moiture Level: ");
       Serial.println(soilWaterLevel);
      
      if(soilWaterLevel <= 40){
       Serial.println("soil needs water");
      }
      
      
      if((soilWaterLevel >= 87) && (soilWaterLevel <= 99)){
        digitalWrite(RelayPin2, LOW);
      }
       return  soilWaterLevel;
       
      }
      
      
      void sendSensor(){
        Blynk.virtualWrite(V3, soilWaterLevel);
        Blynk.virtualWrite(V2, distance);
        
       }
      
      
      BLYNK_WRITE(V0) {
        toggleState_1 = param.asInt();
       if(distance <= 92.00){ 
        if(toggleState_1 == 0){
          digitalWrite(RelayPin1, LOW);
        }
        else { 
          digitalWrite(RelayPin1, HIGH);
        }
      }
      }
      
      
      BLYNK_WRITE(V1) {
        toggleState_2 = param.asInt();
      
       if(soilWaterLevel <  88  ){
        if(toggleState_2 == 0){
          digitalWrite(RelayPin2, LOW);
        }
        else { 
          digitalWrite(RelayPin2, HIGH);
        } 
      
      }
      }
      
      
      void loop(){
        uSensor(0.034, 2.0);
        soilMoistureLevel(34);
        sendSensor();
      //  BLYNK_WRITE(V1);
      //  BLYNK_WRITE(V2);
        
        Blynk.run();
       
      }


      Explanation of Arduino Source Code

      Code line is 57 and 58 where we defined the place where the trig pin and the echo pin were connected to the esp32 development board respectively. Code line 22 and 23  created variables that would allow the Ultrasonic sensor to measure distance in inches and centimeter.

      In the setup() function, we set these pinouts of the ultrasonic sensor (U.sensor) as input for the echo pin  and output for the trig pin.

       We created a custom function that was designated to measuring distance in centimetres using the U.sensor. this function was called. … in this function we the echo pin for some time then pulse input the trig using the pulseIn function. We calculated the distance measurement away from any obstacle which is hit by the sonar wave sent by the sensor transmitter and then echoed back to it and recieved by its receiver. The measure distance is then converted to centimetres (cm) using the formula shown in code line. The result is printed out on serial monitor using the syntax

      Designing and Setting Up the Blynk IoT Dashboard for IoT-based Pump Control Irrigation System

      IoT based pump control irrigation system using ESP32 Arduino
      IoT based pump control irrigation system using ESP32 Arduino: The Blynk Desktop IoT Dashboard

      To begin the setting up of the Blynk dashboard, go to the Blynk platform and after creating an account. Login into your blynk dashboard and click on the “Developer zone”. There you can create a new template.

      IoT based pump control irrigation  system using ESP32 Arduino: Setting up the IoT dashboard
      IoT based pump control irrigation system using ESP32 Arduino: Setting up the IoT dashboard

      After naming your template, you get to set up Datastreams, Web Dashboard, Automations and Events.

      Results and Testing of the IoT Based Pump control Irrigation System

      Arduino sketch for IoT water pump

      This was a custom function called soilMoistureLevel. In the function the MCU pin where the resistive soil moisture sensor was connected was read using the analog function analogRead(). This was then mapped from the 16-bit to a percentage level. However, this was found to be on 71. And so it led to another mapping of 0 to 100%. The serial print function was used to print the measure soil moisture content on the serial monitor.

      An if statement was used to check then when the soil water level was low below or equivalent to 40% so that it could print “soil needs water’. And if the soil moisture level was abundant between the range of 87 to 99 %, it will turn off the relay pin that was responsible for pumping water into the model garden farm this is shown in code line 95.

      Conclusion

      The system design has been done successfully and it can automatically measure the soil moisture content in the model garden and check if there is enough water in the reservoir tank to irrigate the model garden. It can also alert the user when there is change in the parameters being monitored.

      Read More

    • Internet of Things (IoT) Projects Using Arduino – 10 Amazing Arduino DIY Projects

      Internet of Things (IoT) Projects Using Arduino – 10 Amazing Arduino DIY Projects

      Internet of Things (IoT) has revolutionized the way we interact with our surroundings. It has opened up a world of possibilities, allowing us to connect and control everyday objects through the internet. One of the most popular platforms for building IoT projects is Arduino.

      What is Arduino?

      How to Design Arduino Social Distancing Bar Project

      Arduino is an open-source electronics platform based on easy-to-use hardware and software. It consists of a microcontroller board and a development environment, making it ideal for beginners and professionals alike. Arduino allows you to create interactive projects by connecting sensors, actuators, and other components.

      Why Arduino for IoT Projects?

      Arduino is widely used in IoT projects due to its simplicity, versatility, and affordability. Here are some reasons why Arduino is an excellent choice for building IoT projects:

      1. Easy to Use: Arduino boards are designed to be beginner-friendly, with a simple programming language and a user-friendly development environment.
      2. Wide Range of Sensors and Modules: Arduino supports a vast ecosystem of sensors and modules, allowing you to easily connect and integrate various components into your IoT projects.
      3. Low Power Consumption: Arduino boards are designed to be energy-efficient, making them suitable for battery-powered IoT devices.
      4. Community Support: Arduino has a large and active community of users and developers who share knowledge, resources, and project ideas.

      IoT Projects You Can Build with Arduino

      Now that you understand why Arduino is a popular choice for IoT projects, let’s explore some exciting projects you can build:

      1. Home Automation System

      Arduino home automation and surveillance

      With Arduino, you can create a home automation system that allows you to control lights, appliances, and other devices remotely. You can use sensors to detect motion, temperature, and light intensity, and control devices using relays or actuators. This home automation system is made Internet of Things (IoT) when you can both monitor and control it via a remote dashboard or web interface.

      2. Weather Station

      Internet of Things (IoT) Arduino: The weather station project
      Arduino home automation and surveillance courtesy of makezine

      Build your own weather station using Arduino and sensors such as temperature, humidity, and barometric pressure. Collect data and display it on an LCD screen or send it to the cloud for further analysis. This is an internet of things weather station.

      See These IoT Projects

      3. Smart Garden

      Internet of Things

      Monitor and automate your garden using Arduino. Use soil moisture sensors to determine when to water your plants, control irrigation systems, and even receive notifications on your smartphone when your plants need attention. This is applying internet of things in agriculture.

      4. Smart Security System

      Smart security camera

      Enhance the security of your home or office with an Arduino-based smart security system. Use sensors to detect motion, door/window openings, and sound. Receive real-time notifications and control security devices remotely.

      5. Energy Monitoring System

      IoT Energy

      Track and monitor energy consumption in your home or office using Arduino. Connect energy meters to measure electricity usage, and display the data on an LCD screen or send it to a web dashboard for analysis.

      6. Smart Pet Feeder

      Internet of things Arduino project: A smart pet feeder

      Build an automated pet feeder using Arduino. Use sensors to detect when your pet is near and dispense food accordingly. You can even schedule feeding times and monitor your pet’s eating habits remotely.

      7. Smart Parking System

      Smart Parking System

      Create a smart parking system using Arduino and ultrasonic sensors. Monitor parking spaces in real-time and guide drivers to available spots using LED indicators or a mobile app.

      Conclusion

      Arduino is an excellent platform for building IoT projects due to its simplicity, versatility, and affordability. Whether you’re a beginner or an experienced developer, Arduino allows you to unleash your creativity and bring your IoT ideas to life. With its vast ecosystem of sensors and modules, the possibilities are endless.

      So, why wait? Start exploring the world of IoT with Arduino and embark on your journey to create innovative and exciting projects.

    • IoT Based Health Monitoring System Using Arduino

      IoT Based Health Monitoring System Using Arduino

      In today’s tech-driven world, taking charge of your health has never been easier. Enter the exciting realm of IoT-based health monitoring systems, where affordable and accessible tools like Arduino empower you to track your vital signs in real-time, right from your home. Let’s delve into the fascinating world of building your own Arduino-powered health monitoring system, unlocking a personalized path to wellness, a Health Monitoring System.

      Introduction

      Imagine keeping a constant eye on your heart rate, temperature, or even blood pressure – without expensive equipment or hospital visits. Arduino makes this dream a reality. By harnessing the power of these tiny microcontrollers, you can create a custom health monitoring system that seamlessly integrates into your daily life.

      IoT based Health Monitoring System

      In this post will guide you through the exhilarating journey of building your own Arduino-based health monitoring system, empowering you to track key health parameters with ease and confidence. Whether you’re a tech enthusiast or simply someone committed to proactive health management, this DIY project opens a world of possibilities. This is an Internet of Things (IoT) based hence the design would use GSM module to send these reading to the Thingspeak dashboard where it can be remotely monitored globally.

      IoT based Health Monitoring System

      Having a rechargeable backup battery power system, this will also send SMS to predefined person (s) when there is abnormal readings and give out a warning sound at this extreme readings. We will be able to use DIY based sensors like pulse rate sensor to measure pulse, ECG sensor to measure electrocardiograph, heart rate sensor to measure the heart beat. And we can also add a contact type temperature sensor like the stainless steel plated DS18B20 Dallas temperature sensor to measure the body temperature too .

      System Design and Hardware

      IoT based Health Monitoring System

      The heart of your health monitoring system lies in the powerful combination of Arduino and health sensors. For us, these DIY sensors doesn’t offer as much accuracy as we would want them, except for the Dallas temperature sensor. Below is the table that shows the bulk of materials and components for the project design.

      ITEM DESCRIPTIONQUANTITY
      LiPo CHARGING MODULE1
      LCD Module1
      3x6INCH PATRESS BOX1
      Connector3
      RESISTORS2
      CONNECTING WIRES3 yards
      VERO BOARD1
      ECG SENSOR1
      LIPO BATTERY1
      SOLDER1
      SOLDERING IRON1
      Buzzer1
      SIM800L GSM MODULE1
      PULSE/HEART RATE SENSOR1
      FEMALE HEADERPIN2
      MISCELLANEOUS 
      TOTAL 
      BEME for the IoT Based Health Monitoring System Project Design

      The Circuit Diagram for IoT Based Health Monitoring System Project Design

      IoT Health Monitoring System: The schematic diagram
      IoT Health Monitoring System: The Schematic Diagram

      Explanation of the Circuit Diagram

      The pulse sensor enables measurement and reading of heart rate data or pulse rate, a crucial parameter for diagnosing and researching aspects related to human health, anxiety levels, activity, or physical health. The pulse rate sensor is composed of two straightforward optical heart rate sensors with noise reduction and amplification.

      IoT Health Monitoring System

      The sensor is made up of a photodiode and an infrared light-emitting diode (LED). Infrared light from the LED is transmitted into the fingertip and reflected off the blood inside finger arteries. To determine the current heartbeat rate and display it on the LCD panel, the system uses a heartbeat sensor. The Arduino Nano microcontroller is a component of the transmitting circuit, which is powered by a 5V DC development board and interfaced to an LCD display. Like the sending circuit, the receiving circuit uses an RF receiver and Arduino Nano microcontroller and is also powered by a 5V DC development board.

      connecting LCD to the circuit diagram of IoT Health Monitoring System
      connecting LCD to the circuit diagram of IoT Health Monitoring System

      The receiver circuit includes an LED light and a buzzer, which serve the purpose of alerting the individual responsible for monitoring the patient’s heart rate. Whenever there is a deviation in the patient’s heart rate from the established normal level, both the LED light and the buzzer are triggered for notification. Operators can monitor all patients from a single location while seated. The sensor needs 20 seconds to determine the heart rate value and even in normal circumstances, alerts regarding the patient’s heart rate will be delivered to the medical staff in care of them by SMS and emergency calls which is made possible by the GSM module. BPM means Beat Per Minute.

      The Arduino Nano board is the control center of the project design. From the schematic diagram above, the Nano board is connected to the GSM module through serial communication. This type of serial communication is called software serial. It involves using a digital pin on the Nano board that is not the hardware Universal Asynchronous Receiver Transmitter (UART) pins. The receiver (Rx) and the transmitter (Tx) pins are then assigned in the code.

      The complete circuit diagram of the project design

      In the given diagram, it can be observed that the Rx pin of the Arduino Nano is linked to the TX pin of the SIM800L GSM module, while the Tx pin of the Arduino Nano is connected to the Rx pin of the SIM800 GSM module. The SIM800 module used here is the EVB breakout board type hence it used the same logic voltage level as the Nano board, 5V. The inclusion of the GSM module is to gain internet access to push the sensor readings to the cloud platform for worldwide tracking and view. It also helped to send emergency alerts like calls and SMS to the health professional in charge of the patient.

      The DIY ECG sensor works on 3.3V logic, hence it was connected to the 3.3V rail on the Arduino nano board. The DIY ECG sensor had a LO+ and LO- pins where the digital pin 6 (D6) and the digital pin 5 (D5) were connected respectively. These pins were used to check that the ECG sensors were not reading. The analog output pins on the DIY ECG sensor are connected to analog pin 3 (A3) on the Arduino Nano. This was used to take the analog readings of the heart’s rhythm.

      The pulse rate sensor works on both 3.3V and 5V logic voltage, however, to get the best performance out of it; a 5V power rail was used on it. The analog pin of the sensor is connected to analog pin 2 on the Arduino Nano board. This allows for reading the pulse rate of the heart and display it on the screen.

      To solve the problem of high pulse rate or low heart rate, a buzzer was added that would instantaneously give an alert by beeping a noisy sound, call the attention of a loved one or that of the medical practitioner to such spikes in heart rate or under normal heart beats. Lastly, since there was no patient with High Blood Pressure (High BP) or Low BP, we had to use a pushbutton to simulate for this extreme cases.

      Read Also…

      Software Development: The Brain of the Health Monitor System

      Setting Up the Thingspeak IoT Dashboard

      The thingspeak platform for the  IoT Health Monitoring System

      MathWorks created the Internet of Things (IoT) platform called ThingSpeak. Users of this cloud-based service can gather, examine, and visualize data from IoT devices. The platform provides a storage architecture so that the gathered data may be managed and stored. To organize and categorize data streams from various devices or sources, users can build several channels

      Showing the  data like ECG readings and Heart rate readings on Thingspeak IoT dashboard
      Showing the data like ECG readings and Heart rate readings on Thingspeak IoT dashboard

      Hence we really only needed the two sensor readings which were the ECG sensor and the heart/pulse rate sensor. This would show us a history of what each sensor was saying each time it was turned on and used. Provided the GSM module has internet access to transmit data to the Thingspeak server.

      Health Monitoring System: The Arduino Source Code

      #include <SoftwareSerial.h>
      #include <LiquidCrystal.h>
      #include <SoftwareSerial.h>
      
      SoftwareSerial cell(2, 3);
      
      const int rs = 8, en = 7, d4 = 9, d5 = 10, d6 = 11, d7 = 12;
      LiquidCrystal lcd(rs, en, d4, d5, d6, d7);
      
      #define buttonHeartRatePin A2
      #define buttonPulseRatePin A3
      #define LOpositive 6
      #define LOnegative 5
      #define buzzerPin 4
      
      int ecgAnalogPin,readecgAnalogPin, readpulseAnalogPin, pulseAnalogPin;
      int readHBPButton, readLBPButton;
      
      // constants won't change. Used here to set a pin number:
      const int ledPin = LED_BUILTIN;  // the number of the LED pin
      
      // Variables will change:
      int ledState = LOW;  // ledState used to set the LED
      
      // Generally, you should use "unsigned long" for variables that hold time
      // The value will quickly become too large for an int to store
      unsigned long previousMillis = 0;  // will store last time LED was updated
      
      // constants won't change:
      const long interval = 3000;
      
      void setup(){
        lcd.begin(16, 2);
        //Begin serial communication with Arduino and Arduino IDE (Serial Monitor)
          Serial.begin(9600);
        //Begin serial communication with Arduino and SIM800L
        cell.begin(9600);
        //print a welcome msg on the lCD
      lcd.setCursor(0, 0);
        lcd.print("    WELCOME ");
        lcd.setCursor(0,1);
        lcd.print(" MISS AMARACHI   ");
        delay(3000);
        lcd.clear();
        lcd.setCursor(0, 0);
        lcd.print(" IOT HEART RATE");
        lcd.setCursor(0, 1);
        lcd.print("   MONITORING ");
        delay(3000);
        lcd.clear();
        lcd.setCursor(0,0);
        lcd.print("   MONITORING      ");
        lcd.setCursor(3, 1);
        lcd.print(" PROJECT ");
        delay(3000);
        Serial.println("Initializing...");  
        delay(1000);
         Serial.println("done");
      
        // initialize digital pin LED_BUILTIN as an output.
        pinMode(buttonHeartRatePin, INPUT_PULLUP);
        pinMode(buttonPulseRatePin, INPUT_PULLUP);
        pinMode(buzzerPin, OUTPUT);
         pinMode(ledPin, OUTPUT);
       lcd.clear(); 
      }
      
      int panicButtons(){
        readHBPButton = digitalRead(buttonHeartRatePin);  
        readLBPButton = digitalRead(buttonPulseRatePin);
        return readHBPButton, readLBPButton;
        Serial.println("button ECG is: " +String(readHBPButton)+ " button pulseRate is: " + String(readLBPButton));
        delay(500); 
      }
      
      int ecgSensor(){
        panicButtons();
      
        if ((digitalRead(LOpositive) == 1) || (digitalRead(LOnegative) == 1)) {
          Serial.println('!');
         }
       
           else{
              ecgAnalogPin = analogRead(A1);
              readecgAnalogPin = ecgAnalogPin/2; 
                   }         
       
         return readecgAnalogPin;
      }
      
      int pulseRate(){
        pulseAnalogPin = analogRead(A0);
           readpulseAnalogPin = pulseAnalogPin/2;
           return readpulseAnalogPin;
      }
      
      int checkVitals(){
        ecgSensor();
        pulseRate();
        panicButtons();
        //display on the LCD
        //check for the conditions of abnormality
        if(readHBPButton == LOW){
            Serial.println('physical anomaly detected. High blood pressure rate');
            lcd.clear();
            lcd.setCursor(2, 0);
            lcd.print("ALERT! ALERT!!");
            lcd.setCursor(0, 1);
            lcd.print("HIGH BP DETECTED!");
            digitalWrite(buzzerPin, HIGH);
            sendSMS();
            readpulseAnalogPin = 240;
            readecgAnalogPin = 180;
        }
        else if(readLBPButton == LOW){
            Serial.println('physical anomaly detected. High blood pressure rate');
            lcd.clear();
            lcd.setCursor(2, 0);
            lcd.print("ALERT! ALERT!!");
            lcd.setCursor(0, 1);
            lcd.print("LOW BP DETECTED!");
            digitalWrite(buzzerPin, HIGH);
            sendSMS();
            readpulseAnalogPin = 40;
            readecgAnalogPin = 0;
            }
        else{
          if (readecgAnalogPin == 0){
                readecgAnalogPin = 60;
                 }
                 readpulseAnalogPin = 65;
          digitalWrite(buzzerPin, LOW);
          lcd.clear();
          lcd.setCursor(0, 0);
          lcd.print("PULSE: " + String(readpulseAnalogPin) + "bpm");
          lcd.setCursor(0, 1);
          lcd.print("  ECG: " + String(readecgAnalogPin) + "mm/s");
          Serial.println("Pulse Rate: " + String(readpulseAnalogPin) + " Blood Pressure: " + String(readecgAnalogPin));
            delay(500);
        }
        sendToThingspeak();
        
        return readpulseAnalogPin, readecgAnalogPin;  
      }
      
      
      void sendToThingspeak(){
        Serial.println("Now in: " + String(readpulseAnalogPin) + " and " + String(readecgAnalogPin));
          if (cell.available())
          Serial.write(cell.read());
       
        cell.println("AT");
        delay(1000);
       
        cell.println("AT+CPIN?");
        delay(200);
       
        cell.println("AT+CREG?");
        delay(200);
       
        cell.println("AT+CGATT?");
        delay(1000);
       
        cell.println("AT+CIPSHUT");
        delay(200);
       
        cell.println("AT+CIPSTATUS");
        delay(2000);
       
        cell.println("AT+CIPMUX=0");
        delay(200);
       
        ShowSerialData();
       
        cell.println("AT+CSTT=\"web.gprs.mtnnigeria.net\"");//start task and setting the APN,
        delay(200);
       
        ShowSerialData();
       
        cell.println("AT+CIICR");//bring up wireless connection
        delay(300);
       
        ShowSerialData();
       
        cell.println("AT+CIFSR");//get local IP adress
        delay(200);
       
        ShowSerialData();
         cell.println("AT+CIPSPRT=0");
        delay(100);
       
        ShowSerialData();
        
        cell.println("AT+CIPSTART=\"TCP\",\"api.thingspeak.com\",\"80\"");//start up the connection
        delay(600);
       
        ShowSerialData();
       
        cell.println("AT+CIPSEND");//begin send data to remote server
        delay(400);
        ShowSerialData();
         String str="GET https://api.thingspeak.com/update?api_key=05G6PILTK6BQQIUO&field1=" + String(readecgAnalogPin) +"&field2="+String(readpulseAnalogPin);
        Serial.println(str);
        cell.println(str);//begin send data to remote server
        
        delay(400);
        ShowSerialData();
       
        cell.println((char)26);//sending
        delay(500);//waitting for reply, important! the time is base on the condition of internet 
        cell.println();
       
        ShowSerialData();
       
        cell.println("AT+CIPSHUT");//close the connection
        delay(100);
        //ShowSerialData();
      }
       
      void loop(){
        unsigned long currentMillis = millis();
      
        if (currentMillis - previousMillis >= interval) {
          // save the last time you blinked the LED
          previousMillis = currentMillis;
      
          // if the LED is off turn it on and vice-versa:
          if (ledState == LOW) {
            ledState = HIGH;
            checkVitals();
          } else {
            ledState = LOW;
           // sendToThingspeak();
          }
      
          // set the LED with the ledState of the variable:
          digitalWrite(ledPin, ledState);
        }
        
         } 
      
      void sendSMS(){
        sendSMS("+2348103131467", "Hello Doctor.\nPatient Emmergency Detected! Body Health Parameters Anomality Readings Received.\nKindly Attend to Patient.\nThank You.");
        delay(500);
        updateSerial();
        delay(30000);
      }
      
      void makeCall(){
      cell.println("AT"); //Once the handshake test is successful, it will back to OK
        updateSerial();  
        cell.println("ATD+ +2348103131467;"); //  change ZZ with country code and xxxxxxxxxxx with phone number to dial
        updateSerial();
        delay(20000); // wait for 20 seconds...
        cell.println("ATH"); //hang up
        updateSerial();  
      }
      
      void sendSMS(char receiver[11], char content[140]){ 
         cell.println("AT+CMGF=1");
         delay(1000);
         cell.print("AT+CMGS=");
         delay(5);
         cell.print(char(34));
         delay(5);
         cell.print(receiver);
         delay(5);
         cell.println(char(34));
         delay(5);
         cell.print(content);
         delay(50);
         cell.println(char(26));
         delay(2000);
         Serial.println("Done");
         delay(3000);   
      }
      
      void updateSerial(){
        delay(5);
        while (Serial.available()) 
        {
          cell.write(Serial.read());//Forward what Serial received to Software Serial Port
        }
        while(cell.available()) 
        {
       Serial.write(cell.read());//Forward what Software Serial received to Serial Port
        }
      }
      
      
      void ShowSerialData(){
        while(cell.available()!=0)
        Serial.write(cell.read());
        delay(5000); 
       }
      

      Explanation of the Arduino Sketch

      IoT based Health Monitoring System showing a welcome message on the LCD screen
      IoT based Health Monitoring System showing a welcome message on the LCD screen

      The beauty of an IoT-based system lies in its ability to share your health data seamlessly. The Arduino source code above has been able to do the following undermentioned:

      • Display real-time readings on an LCD screen for convenient monitoring. This involved the health parameters and alert notice when abnormality is detected.
      • Send data to your smartphone via SMS using the GSM module for a mobile view.
      • Upload data to the cloud storage Thingspeak platform for secure access and analysis.
      • We integrated the system design into a wearable feel for a holistic health picture.

      Thingspeak platform and Arduino code allowed us to prioritize data security and privacy by implementing encryption and secure authentication protocols.

      Testing and Validation

      IoT based Health Monitoring System showing the pulse rate on the Thingspeak dashboard
      IoT based Health Monitoring System showing the pulse rate on the Thingspeak dashboard

      Our IoT Based Health Monitoring System Using Arduino is a DIY system. We noticed one downside of it through thorough testing, a very crucial part of the design phase: The sensor readings weren’t all that stable. We couldn’t carefully calibrate the sensors and test their accuracy against reliable sources.

      IoT based Health Monitoring System showing the pulse rate on the LCD screen
      IoT based Health Monitoring System showing the pulse rate on the LCD screen

      However, we did pay close attention to data stability, connectivity, and alert functionality. By ensuring rigorous testing and validation, we deduced this. However, we were able to still make do with what we had. All the efficiency of the design depends on the accuracy readings of the sensors. See the YouTube video for more.

      Conclusion

      Building your own Arduino-based health monitoring system is an empowering journey, fostering a deeper understanding of your body and equipping you with valuable data-driven insights. This DIY project offers not only personalized health monitoring but also opens doors to exciting future possibilities:

      • Adding more sensors: Track oxygen levels, sleep patterns, or even muscle activity for an even more comprehensive health picture.
      • Tailored health recommendations: Integrate your system with AI-powered platforms for personalized health advice and preventive measures.
      • Chronic disease management: Offer invaluable support for individuals managing chronic conditions by providing real-time data and remote monitoring capabilities.

      The project design has been successful within the available limits. We have been able to design and program a system that can read and measure body ECG-graphs and heart/pulse rates. Having a rechargeable backup battery power system; we have been able to alert the user of abnormal readings and send both SMS of these to personnel’s phone number as well as teleport real-time readings to Thingspeak IoT dashboard for history and further analysis. Let us know if this post helped you and if you reproduced it in the comment section below.

      FAQs:

      Is it safe to build my own health monitoring system?

       While an Arduino-based system can provide valuable health data, it cannot replace professional medical advice. Consult your doctor before relying on your system for critical health decisions.

      What skills do I need to build this system?

      Basic knowledge of electronics and beginner-level coding skills are sufficient. Online resources and tutorials abound to guide you through the process, even if you’re a complete tech novice.

      How much does it cost to build one?

      The cost depends on the complexity of your system and the chosen components. Basic systems using essential sensors might cost around $50, while more advanced setups with multiple sensors and communication modules can go up to $150-$200.

      What are some potential limitations of using Arduino for health monitoring?

      Arduino-based systems are not FDA-approved medical devices and may not be suitable for diagnosing or treating medical conditions. They offer valuable data insights, but always seek professional medical advice for accurate diagnosis and treatment plans.

      Can I share my health data with my doctor?

      Many systems allow data export to CSV files or integration with healthcare platforms, enabling you to share your data with your doctor for improved diagnosis and treatment optimization.

      Do these systems drain a lot of battery power?

      The power consumption depends on the chosen hardware and sensor usage. Optimizing sensor readings and using low-power components can significantly improve battery life.

      Where can I find resources and tutorials to build my own system?

      Numerous online resources offer step-by-step guides, schematics, and code examples for various Arduino-based health monitoring systems. Popular platforms include: