In today’s era of smart home technology, automating daily tasks has never been easier. One innovative way to modernize your living space is by creating a motorized curtain system. This DIY project allows you to control your curtains using a DC motor, push buttons, and an Arduino Uno. Whether you want to save time, improve convenience, or just add a touch of tech-savvy elegance to your home, this guide will walk you through the process.
Why Build a Motorized Curtain System?
Motorized curtain systems offer several benefits, including:
Convenience: Operate your curtains with a push of a button.
Accessibility: Perfect for hard-to-reach windows.
Energy Efficiency: Automating curtains helps control room temperature by blocking or allowing sunlight as needed.
Cost Savings: DIY systems are significantly cheaper than commercial smart curtain systems.
Select the correct board and COM port, then upload the code.
Step 5: Test the System
Press the open button to see the curtains move in one direction.
Press the close button to reverse the motor’s direction and close the curtains.
Ensure the motor stops when no button is pressed.
Enhancements and Add-Ons
1. Add Remote Control
Incorporate an IR remote or a Bluetooth module to control the curtains wirelessly.
2. Implement Light Sensor
Use an LDR (light-dependent resistor) to automate curtain movement based on sunlight levels.
3. Timer Functionality
Set specific times for the curtains to open or close using a Real-Time Clock (RTC) module.
4. Integrate with a Smart Home System
Connect the system to a platform like Alexa or Google Home for voice-activated control.
Troubleshooting Tips
Motor Doesn’t Run: Check the power supply and motor driver connections.
Buttons Not Working: Verify the pull-down resistor connections.
Curtain Moves Unevenly: Ensure the pulley system is aligned and the motor has adequate torque.
System Overheats: Use a motor driver with sufficient current capacity for your motor.
Conclusion
Building a motorized curtain system using a DC motor, push buttons, and an Arduino Uno is a rewarding project that combines creativity with practicality. With some basic components and programming knowledge, you can bring a touch of automation to your home. Experiment with enhancements to make the system even smarter and more versatile. Start today and transform your living space with this DIY innovation!
Call to Action
Have questions or ideas to enhance this motorized curtain system? Drop your thoughts in the comments below and let’s discuss!
Imagine receiving an alert when your power consumption spikes, helping you avoid hefty electricity bills. Or better yet, picture monitoring your home’s energy usage from your phone, even when you’re miles away. Sounds futuristic, right? Well, thanks to the Internet of Things (IoT), this is not only possible but increasingly common.
In this guide, we’ll walk you through creating an IoT Smart Electricity Meter with real-time monitoring. Whether you’re an IoT enthusiast or just looking to save energy and money, this project is an exciting way to dive into the world of smart home technology.
What Is an IoT Smart Electricity Meter?
At its core, an IoT smart electricity meter is a device that tracks your electricity consumption in real-time and provides data to you through a mobile app or online dashboard. It can:
With IoT integration, you can access data anytime, anywhere, and even automate energy-saving routines.
How Does an IoT Electricity Meter Work?
The system uses sensors to measure the current and voltage in your electrical circuit. This data is processed by a microcontroller (like Arduino or ESP32) and sent to a cloud platform via Wi-Fi. You can then view this data on your smartphone or computer.
Components Needed for IoT Electricity Meter
PZEM module used for Smart electricity meter
Before diving into the build, let’s gather all the components:
ESP8266Microcontroller Development Board:
The ESP8266 development board for Wi-Fi connectivity. It is also the brain of the project design. Once we programmed this dev. board with Arduino, We can use the WiFi connectivity with internet access to send the readings to Thingspeak platform.
Current Sensor: SCT-013 non-invasive current sensor.
Voltage Sensor: ZMPT101B voltage sensor module.
Wi-Fi Module: Built into ESP32/ESP8266.
LCD Display: Optional, for local monitoring.
Breadboard and Jumper Wires: For connections.
Resistors and Capacitors: As needed for the circuit.
Power Supply: To power the microcontroller.
PZEM Single Phase Energy Module
The PZEM energy module was better the Alternating Current (A.C) voltage sensor module and Current sensor module. It had all the energy parameters needed for measure the energy or power consumed effectively.
Step-by-Step Guide to Building an IoT Smart Electricity Meter
Setting Up the Circuit Diagram
Circuit diagram of IoT Smart electricity Meter
The circuit diagram above shows the connection of the ESP8266-12E (NodeMCU) with the rest of the components for the project design. The connection for PZEM module has to be connected as such so as to read the current consumed by the load.
Adding an LCD Display
We connected the LCD to the NodeMCU microcontroller for local readings. Also used an I2C module to simplify wiring.
Writing the Arduino Code
Open the Arduino IDE and install the required libraries:
Wi-Fi Library: For internet connectivity.
Blynk or ThingSpeak Library: To send data to a dashboard.
#include <WiFi.h>
#include <ThingSpeak.h>
const char* ssid = "Your_SSID";
const char* password = "Your_PASSWORD";
WiFiClient client;
unsigned long myChannelNumber = YOUR_CHANNEL_NUMBER;
const char* myWriteAPIKey = "YOUR_API_KEY";
int currentSensorPin = 34;
int voltageSensorPin = 35;
void setup() {
Serial.begin(9600);
WiFi.begin(ssid, password);
while (WiFi.status() != WL_CONNECTED) {
delay(1000);
Serial.println("Connecting to Wi-Fi...");
}
Serial.println("Connected!");
ThingSpeak.begin(client);
}
void loop() {
int currentValue = analogRead(currentSensorPin);
int voltageValue = analogRead(voltageSensorPin);
float current = (currentValue * 5.0 / 1023.0) * 30; // Convert to Amps
float voltage = (voltageValue * 5.0 / 1023.0) * 220; // Convert to Volts
float power = current * voltage; // Calculate power consumption in Watts
Serial.print("Power Consumption: ");
Serial.println(power);
ThingSpeak.setField(1, power);
ThingSpeak.writeFields(myChannelNumber, myWriteAPIKey);
delay(15000);
}
Uploading and Testing
Connect your microcontroller to your computer and upload the code.
Open the Serial Monitor to verify data.
Log into your ThingSpeak (or chosen platform) account and view the real-time data.
Enhancing the Project
Why stop at the basics? Here are some advanced features you can add:
1. Alerts for High Energy Consumption
Program the device to send SMS or email alerts when power usage exceeds a predefined threshold.
2. Appliance Control
Integrate a relay module to turn off devices remotely when they consume excessive power.
3. Historical Data Analysis
Use cloud storage to analyze trends and patterns over days, weeks, or months.
4. Integration with Smart Assistants
Connect your meter to Alexa or Google Home for voice-controlled energy updates.
Applications of IoT Smart Electricity Meters
This device isn’t just for homes—it has diverse applications:
Industrial Monitoring: Track energy usage in factories and warehouses.
Smart Cities: Enable real-time monitoring of municipal energy grids.
Educational Projects: Demonstrate IoT concepts in classrooms and workshops.
Renewable Energy Systems: Monitor solar panel output and efficiency.
Troubleshooting Common Issues
Device Not Connecting to Wi-Fi
Double-check your SSID and password in the code.
Ensure your router supports the 2.4GHz band (required for ESP32/ESP8266).
Inaccurate Readings
Calibrate the current and voltage sensors carefully.
Verify that connections are stable and free of noise.
Data Not Displaying on Dashboard
Check your API key and channel settings.
Ensure the microcontroller is successfully sending data to the cloud.
Real-World Benefits of IoT Smart Electricity Meters
With the growing need for sustainable practices, IoT electricity meters play a pivotal role in:
Energy Conservation: Helps households and businesses reduce waste.
Cost Savings: Alerts users to excessive energy use, avoiding bill shocks.
Automation: Facilitates smart energy management and load balancing.
Conclusion
Building an IoT Smart Electricity Meter with Real-Time Monitoring isn’t just a rewarding DIY project—it’s a step toward a smarter, greener future. By taking control of your energy consumption, you’re saving money, conserving resources, and contributing to a sustainable world.
So, grab your components, fire up your Arduino IDE, and let’s make energy monitoring smarter and more accessible. We’d love to hear about your experience—drop a comment below and share how you customized your smart meter!
FAQs
1. Can I use a different microcontroller for this project? Yes, you can use Arduino with an external Wi-Fi module or Raspberry Pi for more advanced functionality.
2. How accurate is the electricity meter? Accuracy depends on the calibration of your current and voltage sensors. Proper setup ensures reliable readings.
3. Can this meter handle high-power appliances? Yes, but ensure your sensors are rated for the expected current and voltage range. Use appropriate safety measures.
4. Is it possible to monitor multiple circuits with one device? Yes, by adding more sensors and using additional analog/digital pins on the microcontroller.
5. Can I integrate this system with solar panels? Absolutely! Use it to monitor the output of solar panels and track renewable energy usage.
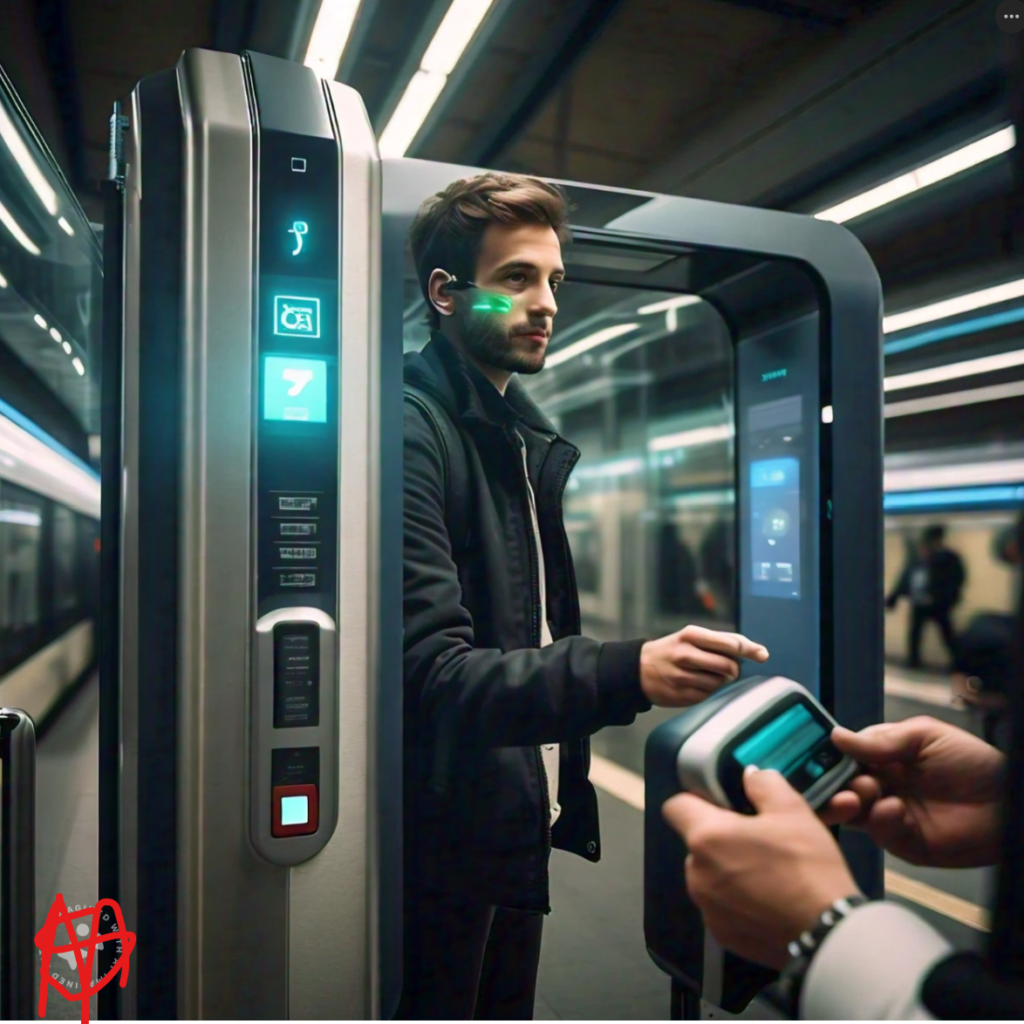
Train journeys have long been a cornerstone of global transportation, offering a convenient and eco-friendly way to travel. However, ticket verification often remains a manual, time-consuming process prone to errors. Imagine a system where passengers simply tap an RFID card, and their journey details are logged instantly. Welcome to the world of RFID Train Passenger Authentication Systems, a game-changer for secure, automated ticketing.
RFID Train Passenger Authentication System
This tutorial dives into the workings, benefits, and implementation of an RFID-based system that enhances ticket verification, saves time, and reduces fraud. Let’s explore how you can bring this futuristic solution to life.
What is RFID Technology?
RFID (Radio Frequency Identification) is a wireless communication technology that uses electromagnetic fields to identify and track objects. An RFID system comprises:
Tags (or RFID cards): Contain unique data.
Readers: Emit signals to detect tags and extract data.
Software: Processes and stores the information.
RFID operates on various frequencies, including low-frequency (LF), high-frequency (HF), and ultra-high-frequency (UHF), each suited to specific applications.
How Does an RFID Train Passenger Authentication System Work?
An RFID train passenger authentication system uses RFID cards issued to passengers. These cards act as digital tickets linked to personal profiles and journey details in a central database.
Here’s how the process unfolds:
Passenger Check-In: Passengers tap their RFID cards at a station kiosk or on-board reader.
Data Validation: The system cross-checks the card data with the backend database.
Journey Logging: Details like boarding station, destination, and fare are logged.
Ticket Confirmation: A display unit shows the passenger’s journey details and status.
The reader communicates with RFID cards to retrieve passenger data. Common choices include MFRC522 or PN532 modules for Arduino-based projects. For this project design, we will be using the MFRC522 module.
RFID Cards
RFID Train transport system: The RFID cards
These cards hold a unique ID linked to the passenger’s account. They can be recharged or programmed for specific journeys.
Arduino Development Board
RFID Train Passenger Authentication System: The Arduino Nano board used for this project
The microcontroller development board used for this project is the Arduino Nano development board. This processes data from the RFID reader and interacts with the database.
A backend database stores passenger profiles, ticket details, and journey logs. Cloud-based solutions like Firebase or on-premises databases like MySQL are popular options.
Display Unit (1604 LCD module)
The type of LCD module used in the RFID Train Passenger Authentication System project
An LCD screen was used to display the ticket status, fare, and other relevant information to passengers.
Benefits of RFID in Train Authentication
1. Enhanced Security
RFID systems reduce the risk of counterfeit tickets by linking cards to a secure database.
2. Improved Passenger Convenience
No more fumbling with paper tickets or waiting in long queues. Tap-and-go authentication streamlines the process.
3. Fraud Prevention
The system ensures only valid, registered passengers can access train services.
4. Cost Efficiency
Automating ticket verification minimizes the need for manual staff, reducing operational costs over time.
How to Build an RFID Train Passenger Authentication System
The Required Components
Arduino Uno
MFRC522 RFID Reader
RFID Cards or Tags
16×2 LCD Display Module
Buzzer (for alerts)
Pushbuttons (optional for manual operations)
Power Supply
Jumper Wires
Database Software (MySQL )
The Schematic Diagram: A Step-by-Step Guide
Explanation of Schematic Diagram: Set Up the Hardware
Connect the RFID reader to the microcontroller.
Interface the LCD display and buzzer for output feedback.
Power up the system using a stable power supply.
Program the Microcontroller
#include <Wire.h>
#include <LiquidCrystal_I2C.h>
#include <SPI.h>
#include <MFRC522.h>
#include <Servo.h>
#define SS_PIN 10
#define RST_PIN 9
MFRC522 mfrc522(SS_PIN, RST_PIN); // Instance of the class
Servo myservo1;
Servo myservo2;
Servo myservo3;
Servo myservo4;
int pos = 0;
MFRC522::MIFARE_Key key;
// Set the LCD address to 0x27 for a 16 chars and 2 line display
LiquidCrystal_I2C lcd(0x27, 16, 2);
void setup() {
lcd.init(); // initialize the lcd
lcd.init();
SPI.begin();
// Initiate MFRC522
mfrc522.PCD_Init();
}
TO SEE THE REST OF THIS CODE, COMMENT BELOW FOR IT
Explanation of Arduino Code
The Arduino code is written as shown above, And we uploaded the code to process RFID data and communicate with the database. Libraries like MFRC522 for Arduino simplify RFID operations.
Test the System
We proceeded to simulate passenger check-ins and verify that the RFID reader correctly logs data into the database and displays output.
Use Cases and Applications
Urban Rail Systems: Simplify ticketing for subways and metros.
Long-Distance Trains: Enable seamless check-ins for intercity travel.
Event Transportation: Manage passenger flow for large gatherings.
Challenges and Limitations
1. Initial Setup Costs
Installing RFID infrastructure can be expensive, especially for large-scale networks.
2. Data Security
Storing passenger details demands robust cybersecurity measures to prevent breaches.
3. Reader Range Limitations
RFID readers must be within close proximity to tags for successful scanning.
The Future of RFID in Public Transportation
With advancements in IoT and AI, RFID systems will integrate with smart city frameworks, enabling real-time passenger tracking, dynamic fare calculation, and predictive analytics. Combining RFID with biometric authentication could further enhance security and convenience.
Conclusion
The RFID Train Passenger Authentication System is a leap toward smarter, more efficient public transportation. By automating ticket verification, this technology offers unparalleled convenience and security for both passengers and operators. Whether you’re a tech enthusiast or a transportation professional, this system is an innovation worth exploring.
FAQs
1. How does RFID improve train ticketing systems?
RFID automates ticket verification, reducing manual errors, enhancing security, and speeding up the boarding process.
2. Is RFID technology secure for passenger data?
Yes, with proper encryption and secure databases, RFID systems protect passenger data effectively.
3. Can this system handle high passenger volumes?
Absolutely! RFID systems are designed to process multiple scans rapidly, making them ideal for crowded train stations.
4. What happens if a passenger loses their RFID card?
Lost cards can be deactivated in the database, and a replacement card can be issued to the passenger.
5. Can this system integrate with mobile payment apps?
Yes, RFID can complement mobile payment systems, allowing passengers to recharge cards via apps for added convenience.
This guide equips you with everything you need to know about RFID train passenger authentication systems. Ready to transform your ticketing process? Share your thoughts or questions in the comments below!
Imagine a world where your doorbell is not just a mundane button but an intelligent device that notifies you, streams live video, and even emails you a snapshot of your visitor. Intriguing, right? Thanks to IoT (Internet of Things), Arduino, and platforms like Blynk, you can create an IoT smart doorbell system that transforms how you interact with your front door.
The IoT Smart Doorbell With Email Alert, Video Stream, Arduino and Blynk courtesy of how2electronics
In this comprehensive guide, we’ll explore how to build an IoT Smart Doorbell with an ESP32-CAM, an ESP8266-12E module for internet connectivity, a pushbutton, a PIR motion sensor, and the Blynk IoT platform for seamless interaction.
Why Build an IoT Smart Doorbell?
Conventional doorbells are outdated in today’s connected world. A smart doorbell offers:
Real-Time Notifications: Alerts you whenever someone is at the door.
Remote Monitoring: Lets you see and interact with visitors even if you’re not at home.
Enhanced Security: Captures images and streams video to ensure you never miss unexpected visitors.
If you’re a tech enthusiast, this project is an exciting way to combine creativity and functionality.
Motion Detection with PIR Sensor: The PIR sensor detects movement near the door, waking up the ESP32-CAM from low-power mode.
Pushbutton Interaction: When the button is pressed, the ESP32-CAM captures an image and sends an email alert to your mailbox.
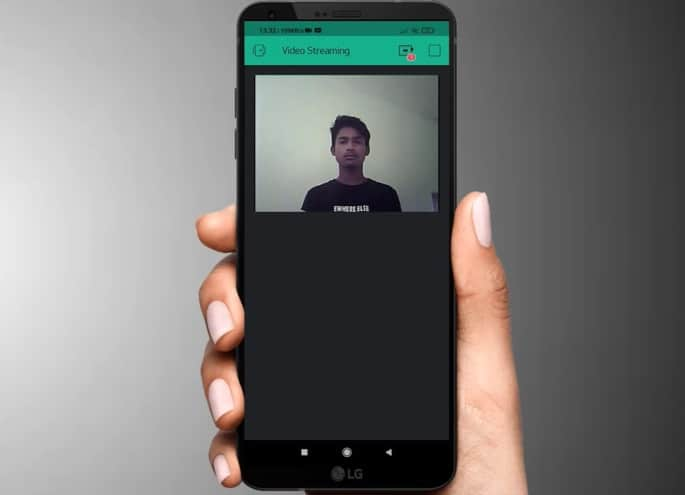
Live Video Streaming: The ESP32-CAM streams live video to your Blynk app’s video widget.
Remote Notifications: The ESP8266-12E ensures real-time updates through the internet, enabling you to stay informed wherever you are.
Step-by-Step Guide to Building the IoT Smart Doorbell
The Schematic Diagram for Setting Up the Hardware
Explanation of Circuit Diagram and ESP32-CAM Connections
We added a buzzer to let the visitor know when he/she is pressing the pushbutton alert for the smart doorbell. Also the battery displayed here can be made to be rechargeable. We added a servo motor to change the direction of the camera. The PIR motion sensor can also be used to put the camera in video streaming mode.
Connect the ESP32-CAM to your power supply.
Link the pushbutton to a GPIO pin on the ESP32-CAM.
Integrate the PIR sensor to another GPIO pin for motion detection.
Blynk is a user-friendly IoT platform that simplifies the process of connecting devices to the cloud.
Real-Time Control: Manage your doorbell system from anywhere.
Video Streaming: Watch visitors in real-time.
Easy Customization: Add widgets for additional features, such as logging visitor data.
Challenges and Solutions
1. False Triggers from PIR Sensor
Solution: Adjust the sensor’s sensitivity or use AI for motion filtering.
2. Network Connectivity Issues
Solution: Use a reliable Wi-Fi network and implement reconnection logic in your code.
3. Power Consumption
Solution: Utilize the ESP32-CAM’s deep sleep mode and wake it only when motion is detected.
Enhancing the System
1. Two-Way Audio
Add a microphone and speaker to enable communication with visitors.
2. Night Vision
Use IR LEDs with the ESP32-CAM for clear night-time images.
3. Cloud Storage
Store captured images and videos on a cloud service like Google Drive for future reference.
4. AI-Powered Detection
Integrate AI to distinguish between humans, pets, and inanimate objects.
Applications of the IoT Smart Doorbell
Home Security: Monitor your front door in real-time.
Office Entry Systems: Enhance access control and visitor logging.
Elderly Assistance: Notify caregivers when someone is at the door.
Conclusion
Building an IoT Smart Doorbell with Arduino, ESP32-CAM, and Blynk combines creativity, functionality, and security. This project not only upgrades your home’s entry system but also introduces you to exciting IoT concepts. Whether you’re a tech enthusiast or someone looking to enhance their home security, this project is a perfect blend of innovation and practicality.
So, are you ready to build your smart doorbell and take your DIY skills to the next level?
FAQs
1. Can I use a different motion sensor instead of the HCSR505?
Yes, you can use advanced motion sensors like the Omron D6T for more precise detection.
2. What is the range of the HCSR505 PIR motion sensor?
The HCSR505 has a range of about 3-7 meters and a detection angle of 100 degrees.
3. How do I ensure the email alert works reliably?
Use a stable internet connection and configure your email server settings properly in the code.
4. Can this system work without the Blynk platform?
Yes, you can use alternatives like MQTT or Firebase for notifications and data handling.
5. Is it possible to store visitor images locally?
Yes, you can store images on an SD card connected to the ESP32-CAM for local storage.
Imagine breezing through toll gates without stopping to fumble for cash or cards. Sounds amazing, right? That’s the promise of an RFID-based toll collection system! In this tutorial, we’ll dive into how these systems work, their benefits, and how you can design one yourself. Whether you’re an automation enthusiast, a transportation expert, or simply curious, this guide is for you.
Toll collection has always been a necessary yet tedious part of road travel. Long queues, delays, and manual errors plague traditional toll systems. Enter RFID-based toll collection—a technology-driven solution to eliminate these bottlenecks. This system uses Radio Frequency Identification (RFID) technology to automate toll collection, making the process faster, more efficient, and less error-prone.
Let’s unravel the workings of this game-changing system step by step.
An RFID-based toll collection system is a wireless, automated payment solution that charges vehicles as they pass through toll gates. The system uses RFID tags attached to vehicles and RFID readers installed at toll plazas. Here’s how it works:
Vehicle Identification: Each vehicle has a unique RFID tag containing payment and identification details.
Wireless Communication: When a vehicle passes through the toll gate, the RFID reader scans the tag wirelessly.
Automatic Deduction: The system deducts the toll amount from the linked account without requiring human intervention.
Barrier Control: The boom gate opens automatically once the transaction is complete.
This simple yet effective process reduces congestion and enhances the toll collection experience for everyone.
How Does RFID Technology Work?
how does RFID technology work
Before diving deeper into the toll collection application, let’s understand RFID technology itself. At its core, RFID operates on three primary components:
RFID Tags
RFID-based toll collection system: RFID tags and card
Types: Passive (no battery, powered by the reader) and Active (battery-powered).
Function: Store data about the vehicle and owner.
RFID Reader
Scans the RFID tag to retrieve stored data.
Sends information to a central system for processing.
Central Database
The Arduino uno board
Stores and manages user data.
Processes payments and sends alerts for low balances or unpaid tolls.
The combination of these components enables seamless communication, ensuring vehicles pass through tolls without delay.
This is the brain of the system. It is the place where the database of the project design is stored.
RFID Reader Module – To scan vehicle tags.
RFID Tags – Attached to vehicles for identification.
LCD Module – Displays transaction details.
Buzzer – Alerts for errors or low balance.
Servo Motor – Controls the boom gate.
Wi-Fi or GSM Module – Enables data transfer to the cloud.
Power Supply – Powers the entire setup.
Circuit Diagram: Step-by-Step Guide to Building the System
schematic diagram of the RFID-based toll collection system
Explanation of the Schematic Diagram
The circuit design shows how the Arduino uno is connected to the rest of the modules in the design. We used a 20 by 4 LCD module for the display. And we added two buttons for the admin to add cash to top cash to the RFID tags and cards that are already registered in the database.
Setting Up the RFID Reader
Connect the RFID reader to the microcontroller as shown in the circuit diagram above.
Test the reader with an RFID tag to ensure it detects the unique ID.
Programming the Arduino Uno Microcontroller
Explanation of Arduino Code
The Arduino program code uses 4 modes of operation. Namely:
Admin RFID card assignment and Addition mode
Admin RFID card removal mode
Admin RFID cash top-up mode
RFID toll collection mode
So I used 3 pushbuttons and I connected them to my Arduino Uno as input_pullups. I want to use the first button as both “menu button and select/enter” button while the second button is the up or increase button whereas the third button is the down or decrease button. The Arduino code allows me select 4 modes using this button in the loop(). The modes being, Add a cade mode, Remove a card mode, top-up a card with an amount mode and charge a card mode
Database Integration (optional)
Link the microcontroller to a central database using a GSM or Wi-Fi module.
Store vehicle details, account balances, and transaction history.
Boom Gate Mechanism
We attached a servo motor to the microcontroller. And programmed the motor to open or close the gate based on payment status.
We simulated vehicle passes using RFID tags. Check if the system accurately identifies tags, processes payments, and operates the gate.
Advantages of RFID-Based Toll Collection
Reduced Traffic Congestion
No more waiting in long queues! Vehicles pass through toll gates seamlessly, reducing delays.
Cost Efficiency
By automating toll collection, labor costs and operational expenses decrease significantly.
Enhanced Accuracy
RFID systems eliminate manual errors, ensuring accurate toll calculation and collection.
Real-Time Monitoring
Data on toll collections and traffic flow can be accessed instantly, aiding decision-making.
Environmental Benefits
Reduced idle times at tolls lead to lower fuel consumption and decreased emissions.
Challenges in Implementing RFID Toll Systems
While the benefits are plenty, some challenges can arise:
Initial Costs: Installing RFID infrastructure can be expensive.
Data Security: Protecting user data from breaches is critical.
Interference Issues: Other RFID systems in the vicinity can cause signal overlap.
User Resistance: Educating users about the new system may require effort.
Real-World Applications of RFID Toll Systems
Many countries have successfully adopted RFID toll systems:
India: The FASTag initiative enables nationwide RFID toll collection.
USA: Systems like E-ZPass simplify toll payments across states.
Singapore: The ERP system charges vehicles automatically for road usage.
These examples showcase how RFID technology can transform transportation infrastructure.
Future of RFID Toll Collection
As technology evolves, RFID toll systems are expected to become smarter. Features like dynamic pricing (charging based on traffic conditions) and integration with GPS for route optimization are on the horizon. Additionally, combining RFID with AI and IoT could revolutionize traffic management further.
Common Misconceptions About RFID Toll Systems
“They’re Expensive to Maintain.” While initial setup costs are high, maintenance costs are minimal compared to manual systems.
“They Invade Privacy.” Data encryption ensures user information remains secure.
“They Can’t Handle High Traffic Volumes.” Modern RFID readers are capable of processing multiple tags simultaneously.
RFID Toll Systems vs. Traditional Toll Collection
Feature
Traditional Toll
RFID Toll System
Processing Speed
Slow
Fast
Accuracy
Prone to errors
Highly accurate
Labor Costs
High
Low
Traffic Congestion
Significant delays
Minimal
Environmental Impact
Higher emissions
Reduced emissions
Tips for Successful Implementation
Choose RFID equipment with high accuracy and durability.
Conduct trials in low-traffic areas before full-scale implementation.
Educate drivers about system usage and benefits.
Regularly update the system software to address bugs and enhance features.
Conclusion: Driving into the Future with RFID
RFID-based toll collection systems are a leap toward smarter, faster, and more efficient transportation. By automating payments and reducing congestion, these systems save time, cut costs, and improve the overall driving experience. As we embrace this technology, the roads ahead look smoother—literally and figuratively.
So, whether you’re planning to build your own system or advocate for its adoption, RFID toll systems are undoubtedly the way forward.
FAQs
1. How does an RFID toll collection system work?
An RFID reader scans the RFID tag on a vehicle, retrieves its details, and deducts the toll amount automatically from a linked account.
2. What are the benefits of RFID toll systems?
They reduce traffic congestion, enhance accuracy, lower operational costs, and provide real-time monitoring of toll collections.
3. Can RFID tags be reused?
Yes, RFID tags are reusable. Once linked to a vehicle and account, they function until damaged or replaced.
4. How secure are RFID toll systems?
Modern RFID systems use encryption to protect user data, making them highly secure.
5. Are RFID toll systems suitable for rural areas?
Yes, they can be implemented in rural areas, but infrastructure and user education are key to their success.
You can watch the YouTube video demo of the project design above as shown. The schematic diagram and modelling is also shown there.
Introduction
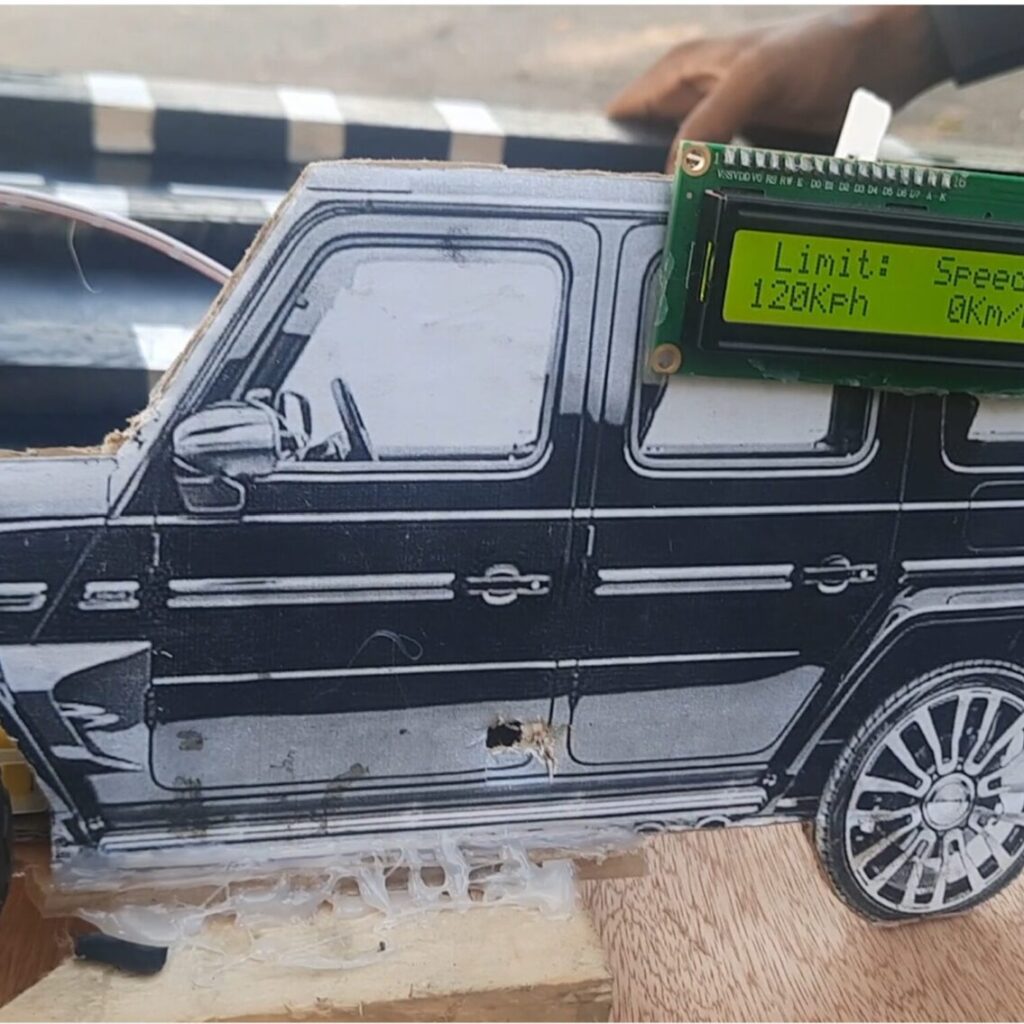
The model of the Arduino over-speeding limit project
Ever wished there was a system that could limit vehicle speed to improve road safety? Imagine a setup where, regardless of how much you press the accelerator, your vehicle won’t go beyond a preset speed limit. This concept is called “speed limiting” and is increasingly relevant for modern traffic control. In this guide, we’re going to model this idea using Arduino and create a DIY over-speeding limit project that responds to set speed limits.
Let’s dive into the fascinating process of building a mini version of a speed control system. This tutorial will walk you through every component and step you need to complete this project, from setting up the sensors to coding the Arduino Nano.
In real-world applications, speed limiters control how fast a vehicle can go, enhancing safety by limiting top speeds on specific road sections. For this project, we’re building a prototype that allows a model car to self-regulate its speed based on different “zones” where sensors impose limits.
Objective of the Project
Our goal is to create a system that can simulate a car responding to speed limits. When the model car enters a designated area, it will automatically adjust its speed to match the set limit. This project is an excellent exercise in programming, sensor integration, and understanding the fundamentals of speed control.
Required Components and Their Functions
Let’s take a look at the components required to bring this project to life.
Arduino Nano
The Arduino Nano serves as the brains of this project. Its compact size and compatibility with the Arduino IDE make it an ideal choice.
Infrared Speed Sensor
The infrared speed sensor module used for the project design
This sensor detects the model car’s speed. When the speed exceeds the set threshold, the system will adjust the motor speed accordingly.
The motor driver module interfaces between the Arduino and the DC motor, controlling speed and direction based on the Arduino’s signals.
DC Motor
Arduino DC motor and tyre used for the over-speeding limit project design
The DC motor simulates the vehicle’s movement, driving the wheels at various speeds based on input from the motor driver.
1602 LCD Module
The LCD module will display the current speed and issue warnings if the vehicle exceeds set limits. It’s an effective way to monitor the system in real time.
Pushbuttons act as manual controls for the “driver” to increase or decrease speed, helping to simulate real driving conditions.
Understanding Speed Regulation in This Project
Speed Control Logic
The road model of the over-speeding limiter project design
The speed control logic involves using an infrared speed sensor to detect how fast the model car is moving. The Arduino receives this information and decides whether to reduce or maintain speed based on some set speed limts on the modelled road. This project mimics a real-world traffic speed limiter by enforcing preset speed thresholds in specific “zones.”
Simulation of Speed Limit Zones
Imagine a road where each section has different speed limits. This project achieves a similar effect by programming certain thresholds that the car must respect. As the model car moves through these zones, the Arduino makes speed adjustments to keep the car within safe limits.
The circuit diagram of the Arduino over-speeding limit project design ( breadboard version)
We used the infrared speed sensor in our design to check the number of revolutions hence was able to calculate the speed of the model car.
Step 2: Connect the Infrared Speed Sensor
Placing the Sensor
Position the infrared speed sensor along the path of the model car. It’s essential to place the sensor in a way that can accurately read the wheel’s rotation or another moving part.
Code for Speed Detection
The speed sensor will send readings to the Arduino. Here’s a simple code snippet to read and print speed data:
int speedPin = A0; // Replace with the actual pin for your sensor
float speed;
void setup() {
Serial.begin(9600);
pinMode(speedPin, INPUT);
}
void loop() {
speed = analogRead(speedPin);
Serial.println(speed);
delay(100);
}
This code reads speed data, which we can later use to determine whether adjustments are necessary.
Step 3: Integrate the Motor Driver and DC Motor
Connecting the Motor Driver
The schematic diagram of the project design
Connect the motor driver to the Arduino Nano, ensuring the motor driver’s outputs are connected to the DC motor terminals.
Testing the DC Motor
Load a test sketch to check if the motor responds to speed adjustments. Verify that the motor spins at varying speeds depending on Arduino signals.
Step 4: Adding the 1602 LCD Display
Setting Up the Display
Wire the LCD display to the Arduino. Ensure proper connections for SDA, SCL, VCC, and GND.
Over-Speeding Limiter Project Design Arduino Code
The LCD will show the current speed and issue over-speed warnings. Here’s the complete Arduino code.
Connecting and Coding Pushbuttons
Connect two pushbuttons to the Arduino. These will simulate the driver’s attempt to accelerate or decelerate. Program the buttons to adjust the car’s speed within a safe range.
Testing and Troubleshooting the Project
Debugging Tips
Sensor Calibration: If speed readings seem inaccurate, try repositioning the infrared sensor.
Motor Response: Test the motor independently to rule out power or connection issues.
Testing Scenarios
Simulate different speed zones by programming various speed thresholds and testing the model car’s response as it moves from zone to zone.
Conclusion
This over-speeding limit project demonstrates the power of Arduino in creating practical, real-world systems. Speed regulation is crucial for road safety, and this project simulates how technology can help enforce speed limits. We hope you enjoyed building this model and encourage you to experiment further—perhaps by adding new speed zones or exploring other sensors. Happy building!
Call to Action
Did you enjoy this project? Let us know in the comments below! For more Arduino ideas, check out our other tutorials and join our community of makers.
FAQs Arduino Over-speeding Limit Project Design
1. How does the over-speeding control work in this project? The infrared sensor detects speed, and if it surpasses set limits, the Arduino adjusts the motor speed to keep it within safe thresholds.
2. Can I use a different Arduino model? Yes, other models like the Arduino Uno can work, though you might need to adjust some wiring and code.
3. Is the LCD display necessary? The LCD display is optional but recommended for real-time feedback on speed and warnings.
4. What power source should I use? You can use a 9V battery or USB power, but ensure it matches the motor’s requirements for smooth operation.
5. How do I simulate multiple speed zones? Use conditional statements in the code to trigger specific speed limits based on data from the infrared sensor.
Parking spaces are becoming increasingly scarce in densely populated cities. As more vehicles hit the road, the demand for efficient parking management systems is skyrocketing. Traditional parking systems are often inefficient, leading to long queues, frustration, and wasted time. This is where the RFID-based Smart Parking System comes into play. By utilizing Radio Frequency Identification (RFID) technology, smart parking systems can automate entry and exit, ensure real-time space availability tracking, and enhance overall parking management.
In this tutorial, we’ll dive into how RFID technology works, its applications in parking systems, and how you can implement an RFID-based smart parking system yourself. Whether you’re a tech enthusiast, an urban planner, or a business owner looking to optimize parking, this guide is for you!
What is an RFID-Based Smart Parking System?
RFID-Based Smart Parking System
An RFID-based Smart Parking System is an automated solution that leverages RFID technology to streamline the parking process. By embedding RFID tags in vehicles and installing RFID readers at entry and exit points, the system can automatically identify vehicles, grant access, and record parking details. This eliminates the need for manual intervention, reduces parking lot congestion, and improves user experience.
How Does RFID Work?
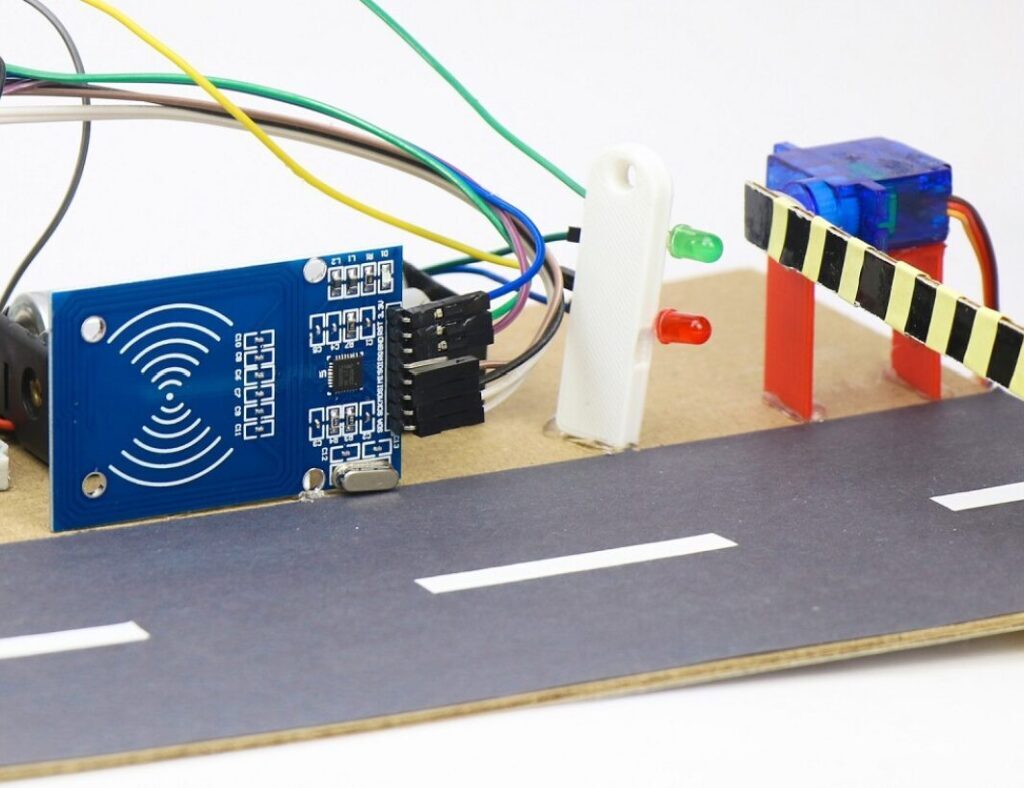
RFID based smart parking system: The RFID reader, cards and tags
Before we jump into the parking system, let’s briefly explain how RFID technology works. RFID systems consist of two main components:
RFID Tags: These are small devices containing a microchip and an antenna. They can be either passive (no internal power source) or active (battery-powered). Passive tags rely on the RFID reader to send power to them.
RFID Readers: These are devices that send out radio waves to communicate with the RFID tags. When an RFID tag comes within range of the reader, the reader sends a signal to the tag, prompting it to transmit its stored data back to the reader.
To implement an RFID-based smart parking system, several key components are necessary:
RFID Tags: These are attached to vehicles and contain unique identification information.
RFID Reader: Installed at the parking lot’s entrance and exit points, the reader scans the RFID tags to identify vehicles.
Arduino Nano Board: The Arduino Nano board was used because of this small size. We used this to read the RFID reader. This is where we wrote the whole code that would read and recognize the registered
Barrier Gate or Automated Entry System: Controls vehicle access to the parking area by lifting or lowering barriers based on the data received from the RFID reader.
Database: Stores information about registered vehicles, their RFID tags, parking duration, and payment history. We did all of these on the Arduino Nano development board.
Advantages of RFID-Based Smart Parking Systems
Faster Entry and Exit
uhf rfid technology used in RFID-based parking system
One of the key advantages of an RFID-based system is the ability to speed up vehicle entry and exit. With RFID technology, vehicles don’t need to stop at ticket booths or manually swipe cards. Instead, the system identifies the vehicle’s RFID tag automatically, allowing drivers to enter and exit the parking lot without delays.
Enhanced Security
An RFID-based system increases parking security by ensuring that only authorized vehicles can enter the premises. The unique RFID tag is linked to a registered user and vehicle, reducing the risk of unauthorized access.
Real-Time Parking Availability Tracking
Smart parking systems can provide real-time updates on parking space availability. Sensors installed in the lot can detect whether a parking spot is occupied or free, and the system can direct incoming vehicles to available spaces. This not only saves time but also prevents unnecessary congestion.
Cashless and Contactless Payment
RFID-based systems can integrate with mobile apps or payment gateways to enable cashless, contactless payment. This is particularly relevant in a world that’s moving towards digital transactions. Users can pay for their parking through mobile apps linked to the RFID tag, eliminating the need for cash or physical tickets.
Efficient Parking Management
Parking lot operators benefit from better data management. With an RFID system in place, operators can track the number of vehicles in the lot, monitor parking durations, and generate reports on parking trends. This helps optimize parking space utilization and revenue generation.
How to Build an RFID-Based Smart Parking System: The Schematic Diagram
breadboard view circuit diagram of RFID-Based Smart Parking System
This breadboard view circuit diagram of RFID-Based Smart Parking System showed us that we used 4 servo motors for the schematics. The first servo motor is placed at the entrance while the second is placed at the first parking slot, the third servo motor placed at the second parking slot, and the fourth servo motor is placed at the third or last parking slot. Since we only modelled 3 parking slots for this project design.
We needed as extra power supply for the system design, if not the USB power from the PC would not be enough to power the 4 servo motors at the same time.
Programming The Arduino Board For This Project Design
#include <Wire.h>
#include <LiquidCrystal_I2C.h>
#include <SPI.h>
#include <MFRC522.h>
#include <Servo.h>
#define SS_PIN 10
#define RST_PIN 9
MFRC522 mfrc522(SS_PIN, RST_PIN); // Instance of the class
Servo myservo1;
Servo myservo2;
Servo myservo3;
Servo myservo4;
int pos = 0;
MFRC522::MIFARE_Key key;
// Set the LCD address to 0x27 for a 16 chars and 2 line display
LiquidCrystal_I2C lcd(0x27, 16, 2);
void setup() {
lcd.init(); // initialize the lcd
lcd.init();
SPI.begin();
// Initiate MFRC522
mfrc522.PCD_Init();
// Print a message to the LCD.
lcd.backlight();
lcd.setCursor(0,0);
lcd.print("WELCOME ENGINEER");
lcd.setCursor(0,1);
lcd.print(" TOMIWA ");
delay(2000);
lcd.setCursor(0,0);
lcd.print(" RFID BASED ");
lcd.setCursor(0,1);
lcd.print("PARKING SYSTEM");
delay(2000);
myservo1.attach(2);
myservo2.attach(6);
myservo3.attach(5);
myservo4.attach(7);
//close all gates
myservo1.write(90);
myservo2.write(180);
myservo3.write(20);
myservo4.write(0);
}
void firstServoOpen(){
lcd.setCursor(0, 0);
lcd.print("PLS WAIT CHEKING");
lcd.setCursor(0, 1);
lcd.print("DATABASE");
for(int i = 0; pos <= 6; pos += 1)
{
lcd.print(".");
delay(15);
}
for(pos = 110; pos <= 180; pos += 1)
{
myservo1.write(pos);
delay(15);
}
}
void firstServoClose (){
for(pos = 180; pos>=90; pos-=1)
{
myservo1.write(pos);
delay(15);
}
}
void secondServoOpen(){
for(pos = 180; pos >= 100; pos -= 1)
{
myservo2.write(pos);
delay(15);
}
}
void secondServoClose() {
for(pos = 100; pos<=180; pos+=1)
{
myservo2.write(pos);
delay(15);
}
}
void thirdServoOpen(){
for(pos = 20; pos <= 100; pos += 1)
{
myservo3.write(pos);
delay(15);
}
}
void thirdServoClose(){
for(pos = 100; pos>=20; pos-=1)
{
myservo3.write(pos);
delay(15);
}
}
void forthServoOpen(){
for(pos = 0; pos <= 100; pos += 1)
{
myservo4.write(pos);
delay(15);
}
}
void forthServoClose(){
for(pos = 100; pos>=0; pos-=1)
{
myservo4.write(pos);
delay(15);
}
}
void loop() {
//myservo2.write(100);
lcd.setCursor(0, 0);
lcd.print(" GATE CLOSED ");
lcd.setCursor(0, 1);
lcd.print("SWIPE FOR ENTRY");
// Look for new cards
if ( ! mfrc522.PICC_IsNewCardPresent())
{
return;
}
// Select one of the cards
if ( ! mfrc522.PICC_ReadCardSerial())
{
return;
}
//Show UID on serial monitor
Serial.println("UID tag :");
String content= "";
byte letter;
for (byte i = 0; i < mfrc522.uid.size; i++)
{
//Serial.print(mfrc522.uid.uidByte[i] < 0x10 ? " 0" : " ");
// Serial.print(mfrc522.uid.uidByte[i], HEX);
content.concat(String(mfrc522.uid.uidByte[i] < 0x10 ? " 0" : " "));
content.concat(String(mfrc522.uid.uidByte[i], HEX));
}
Serial.println();
Serial.print("Message : ");
content.toUpperCase();
//this is where u put the UID of the card that you want to give access
if (content.substring(1) == "77 F5 76 63") {
firstServoOpen();
delay(2000);
lcd.setCursor(0, 0);
lcd.print("WELCOME MR. OLU ");
lcd.setCursor(0, 1);
lcd.print("PLS GO 2 SLOT 3 ");
delay(3000);
forthServoOpen();
delay(1000);
firstServoClose();
delay(6000);
forthServoClose();
}
if (content.substring(1) == "77 D7 75 63") {
firstServoOpen();
delay(2000);
lcd.setCursor(0, 0);
lcd.print("WELCOME TOMIWA ");
lcd.setCursor(0, 1);
lcd.print("PLS GO 2 SLOT 1 ");
delay(3000);
secondServoOpen();
delay(1000);
firstServoClose();
delay(6000);
secondServoClose();
}
if (content.substring(1) == "D7 21 7A 63") {
firstServoOpen();
delay(2000);
lcd.setCursor(0, 0);
lcd.print("WELCOME Ms. IFE ");
lcd.setCursor(0, 1);
lcd.print("PLS GO 2 SLOT 2");
delay(3000);
thirdServoOpen();
delay(1000);
firstServoClose();
delay(6000);
thirdServoClose();
}
}
Explanation of Th Arduino Code
This code is for an RFID-based parking system that operates four servo motors controlling access gates to different parking slots. The system uses an RFID reader (MFRC522) to identify RFID cards, a 16×2 I2C LCD to display messages, and servo motors to open and close the gates. The code first initializes the LCD, SPI interface, RFID module, and servos. It then displays a welcome message on the LCD and ensures all gates are closed by setting the servos to specific positions.
In the loop() function, the code continuously checks if a new RFID card is present. If a card is detected, it reads the card’s unique identifier (UID) and compares it with predefined UIDs for specific users. When a match is found, the code opens the first gate by moving the servo motor from a closed position to an open position using the firstServoOpen() function. Depending on the user, a personalized message is shown on the LCD (e.g., “WELCOME TOMIWA” or “WELCOME Ms. IFE”), and the corresponding parking slot gate is opened. After a delay, the gate is closed again.
The servo motors for each parking slot are controlled with functions like secondServoOpen() and thirdServoOpen() to ensure smooth gate operation. The system allows for up to four slots, each controlled by its own servo motor. This combination of RFID detection, personalized messaging on the LCD, and servo motor control creates a simple yet functional automated parking system where each authorized RFID cardholder is directed to a specific parking slot, and gates are operated automatically based on the card detected.
How to Implement an RFID-Based Smart Parking System
Building an RFID-based parking system is easier than you might think. Here’s a step-by-step guide on how to get started.
Step 1: Define the Scope
Before diving into the technical aspects, define the scope of your system. Are you implementing it for a small private lot, a large shopping mall, or a multi-level parking garage? The size of the lot will determine the number of RFID readers, tags, and software complexity needed.
Step 2: Select the Right RFID Technology
Choosing between passive and active RFID tags is crucial. Passive RFID tags are cheaper and don’t require a power source, making them ideal for most parking applications. Active RFID tags, while more expensive, can be read from greater distances and offer additional features like GPS tracking.
Step 3: Install RFID Readers
Install RFID readers at the entrance and exit points of the parking lot. These readers will scan the RFID tags on vehicles as they pass through. For large parking lots, you may also want to install readers throughout the lot to track the location of vehicles within the space.
Step 4: Set Up Parking Management Software
The heart of your smart parking system lies in the parking management software. This software processes the data received from the RFID readers and tracks each vehicle’s entry and exit time, parking duration, and payment status. Many software solutions also offer real-time parking availability tracking.
Step 5: Implement Barrier Gates or Access Control
To fully automate the system, you’ll need barrier gates that open and close based on the data received from the RFID reader. When a vehicle with a registered RFID tag approaches, the barrier lifts to allow entry. If an unauthorized vehicle attempts to enter, the system denies access.
Step 6: Connect to a Payment Gateway
To simplify payment, integrate your system with a cashless payment gateway. This allows users to pay through a mobile app linked to their RFID tag or through other online payment options. You can also offer prepaid accounts or subscriptions for frequent users.
RFID-Based Parking Systems vs. Traditional Systems
Traditional Parking Systems: The Old Way
Traditional parking systems rely on physical tickets or cards. Drivers have to collect a ticket upon entry, keep track of it during their stay, and pay manually at a kiosk before exiting. While this method is simple, it can lead to long lines at the ticket booth, especially during peak hours. There’s also a higher risk of losing the ticket or card.
RFID-Based Systems: The Modern Solution
RFID-based systems remove the need for physical tickets, creating a faster, more seamless experience for drivers. Since the system automatically tracks vehicles using RFID tags, there’s no need to worry about losing parking tickets or standing in line to pay. The result is an efficient, hassle-free parking experience that benefits both drivers and parking operators.
Applications of RFID-Based Smart Parking Systems
Commercial Parking Lots
RFID technology is widely used in commercial parking lots, especially in shopping malls and office complexes. These lots often have high traffic volumes, and RFID-based systems allow for quicker entry and exit, reducing congestion during busy periods.
Residential Complexes
Many residential complexes have started implementing RFID-based parking systems to provide residents with a smoother parking experience. Residents receive RFID tags that grant them automatic access to the parking area, while unauthorized vehicles are blocked from entry.
Corporate Campuses
Large corporate campuses can benefit from RFID-based parking systems by providing employees with RFID tags linked to their vehicles. This ensures that only authorized employees can access the parking facility, enhancing security and simplifying parking management.
Hospitals and Healthcare Facilities
Hospitals and healthcare facilities often struggle with managing large volumes of vehicles. RFID-based parking systems help streamline the process for patients, staff, and visitors, making parking less stressful in an already high-pressure environment.
Airports
Parking at airports can be a challenge due to the high volume of vehicles. RFID systems simplify the process for travelers, allowing them to quickly enter and exit the parking area without dealing with paper tickets or long lines.
Common Issues and Troubleshooting
RFID Reader Not Detecting Tags
One common issue is the RFID reader not detecting vehicle tags. This can happen if the reader is not positioned correctly or if the tag is damaged. Ensure that the reader is installed at an optimal height and angle, and check the condition of the RFID tags regularly.
Barrier Gate Not Opening
If the barrier gate isn’t opening when a registered vehicle approaches, it could be due to a delay in the system’s response or a problem with the RFID reader. Try restarting the system and testing the RFID reader’s functionality.
System Delays
System delays can occur if there’s too much data being processed at once or if the software is not optimized. Consider upgrading the system or performing regular maintenance to avoid slow response times.
Conclusion
The RFID-Based Smart Parking System represents the future of parking management. By automating vehicle identification, entry, and exit, this system enhances the parking experience for both users and operators. With faster access, improved security, and real-time tracking, RFID technology is transforming the way we park. Whether for commercial lots, residential complexes, or airports, implementing an RFID-based system is a smart move toward efficient and hassle-free parking.
FAQs About RFID-Based Smart Parking Systems
1. How much does it cost to implement an RFID-based smart parking system?
The cost of an RFID-based parking system depends on the size of the parking facility and the type of RFID technology used. For small lots, the setup can cost anywhere from a few hundred to a few thousand dollars. Larger facilities may require more RFID readers and a sophisticated software system, increasing the cost.
2. Can I use passive RFID tags for my smart parking system?
Yes, passive RFID tags are commonly used in smart parking systems due to their low cost and maintenance. Since passive tags do not require an internal power source, they are ideal for vehicle identification in most parking applications.
3. How do I maintain my RFID-based parking system?
Maintaining an RFID-based parking system is relatively straightforward. You’ll need to ensure that RFID readers are working correctly and are not obstructed. Regularly check the RFID tags for wear and tear, and perform software updates to keep the system running smoothly.
4. Is it possible to integrate an RFID parking system with existing security features?
Absolutely! RFID-based parking systems can be integrated with other security features such as surveillance cameras, alarms, and access control systems. This integration provides a comprehensive security solution that monitors vehicles and ensures only authorized individuals can access the facility.
5. Can I expand my RFID-based parking system in the future?
Yes, RFID systems are scalable. You can start with a small setup and add more RFID readers, tags, or parking management software as your needs grow. This flexibility makes RFID-based systems a great investment for both small and large parking lots.
Solar energy is one of the most accessible and environmentally friendly sources of power. However, capturing this energy efficiently requires a system that can follow the sun’s path, ensuring optimal exposure throughout the day. This is where a solar tracker comes in. In this article, we’ll walk you through building a solar tracker system integrated with weather station monitoring. The system will use an Arduino Mega to read weather sensors and control the orientation of a 10W solar panel to optimize sun exposure.
block diagram for the solar tracker with weather station design
A solar tracker is a device that orients solar panels toward the sun to maximize energy capture. Unlike static panels, solar trackers follow the sun’s movement, increasing the efficiency of solar energy collection by up to 30-50%.
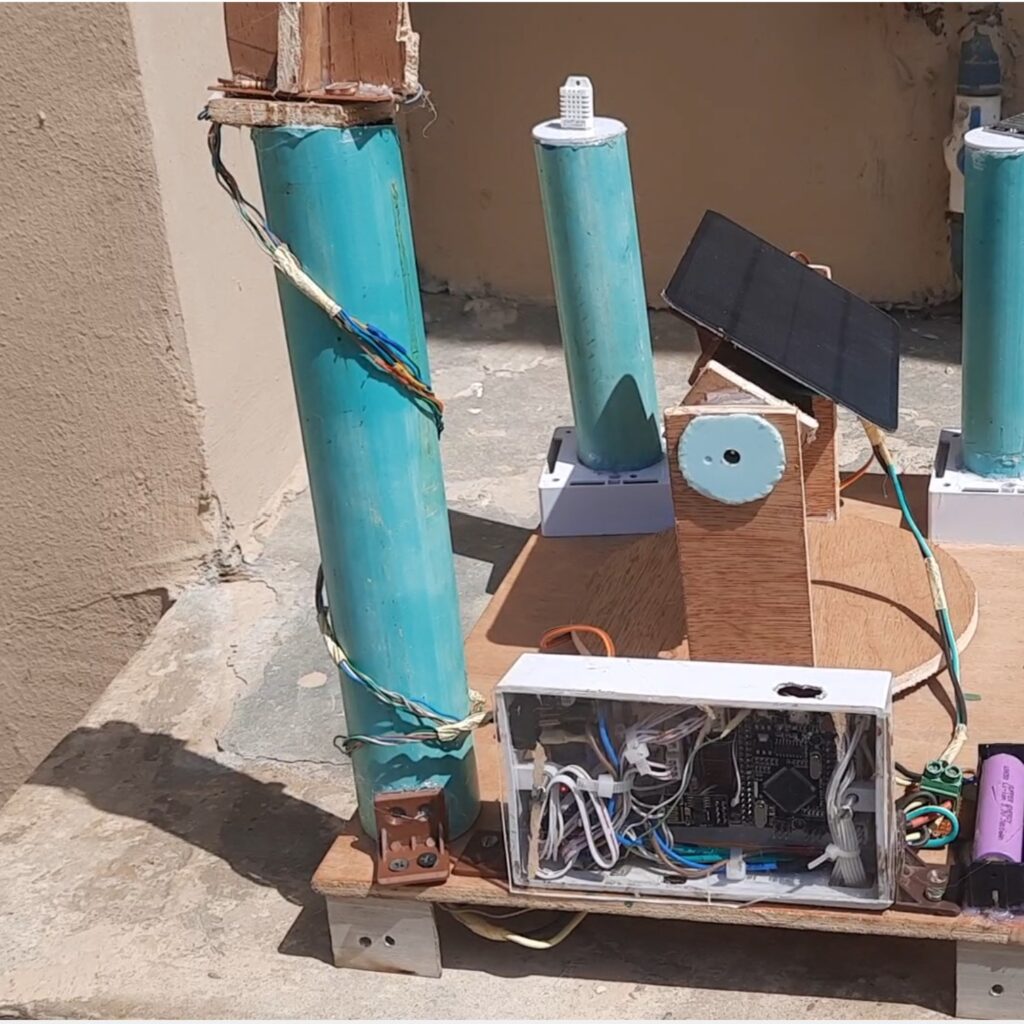
The solar tracker with weather station project design
In this project, we enhance our solar tracker with weather station features. The system not only tracks the sun but also collects environmental data, providing real-time information on temperature, humidity, and rainfall.
Building your own solar tracker with weather station monitoring offers multiple benefits:
Increased Solar Efficiency: Solar panels follow the sun’s path for optimal exposure.
Real-time Weather Monitoring: Get live updates on the environmental conditions affecting your solar system.
Educational Experience: This project offers an opportunity to learn about solar energy, electronics, and IoT integration.
Materials and Components Needed
For this project, here’s a list of all the components and modules we used:
Arduino Mega 2560 Compact Board Type: Acts as the brain of the system, reading sensors and controlling servos. You can also use any other Arduino board of your choice. We found that this was cheaper and provided us with the needed IO pins we needed in the project design.
10W Solar Panel: This is the panel that will follow the sun’s movement. It is also used to charge the backup battery using a DC-DC buck converter or a LiPo charging module.
DHT22 Sensor: Measures temperature and humidity. We needed to measure the atmospheric temperature and the humidity. Hence we implored this module for that job.
Rain Sensor Module: Detects rainfall and alerts the system. We used this to know when there is rain drops or simulate the advent of rain fall for the solar tracker with weather station design.
2 Servo Motors: Used to adjust the position of the solar panel. The directional movement of the solar panel in the horizontal and vertical directions are actually done by these pair. One of these is responsible for the vertical movement while the other the horizontal rotation.
ESP8266-01 Module (Optional): For sending data to an IoT platform. Since We included an upgrade of IoT to the project, We used the ESP-01 module to send the readings to the Zafron IoT dashboard. However, you can add a display screen and save yourself this hassle.
DC-DC Buck Converter: Used to regulate the voltage for the Arduino and other components.
3.7V LiPo Batteries (2x): Backup power source to ensure the system runs even during cloudy conditions.
Connecting Wires, female header pin, connectors and Other Connecting Materials: Essential for wiring and connecting components.
In this project, we are building a dual-axis solar tracker, which allows movement in two directions: horizontal and vertical. This ensures that the solar panel can follow the sun as it moves from east to west, and also adjusts its tilt as the sun’s angle changes throughout the day.
Solar Tracker With Weather Station: The Schematic Diagram
The Schematic Diagram of Solar Tracker With Weather Station
Explanation of the The Schematic Diagram of Solar Tracker With Weather Station
Attaching the Servo Motors
We needed two servo motors—one to control the horizontal movement and another to control the tilt. According to the schematic diagram above, here’s how to wire the servos to the Arduino Mega:
Servo 1 (Horizontal): Connect the signal pin to pin 10 on the Arduino.
Servo 2 (Vertical): Connect the signal pin to pin 11 on the Arduino.
We powered the servos using the 5V from the DC-DC buck converter.
The DHT22 sensor will be used to measure the temperature and humidity of the environment. Here’s how we wired it:
VCC: Connect to 5V on the Arduino.
GND: Connect to Ground.
DATA: Connect to pin D47 on the Arduino.
Wiring the Rain Sensor
The rain sensor detects the presence of rainfall. This sensor will be particularly useful in conditions where solar energy collection is reduced due to rain. Here’s the wiring:
Measuring Voltage and Current of The PV and Battery
We included two sensors, the voltage sensor module and the current sensor module to measure the voltage and current of the solar panel that is being dissipated onto the batteries. We used the whole project as an entire load for the current sensor module.
Programming the Arduino Mega 2560
Once everything is wired, it’s time to write the Arduino code. We used the following Arduino code:
#include <Servo.h> // include Servo library
#include "DHT.h" // include the DHT22 sensor lib
#include <SoftwareSerial.h>
SoftwareSerial arduino(30, 28);// hardware Rx<=>D26, hardware Tx<=>31, IO0 <=>D28, IO2<=>D30
// 180 horizontal MAX
Servo horizontal; // horizontal servo
int servoh = 45; // 90; // stand horizontal servo
int servohLimitHigh = 120;
int servohLimitLow = 10;
// 65 degrees MAX
Servo vertical; // vertical servo
int servov = 45; // 90; // stand vertical servo
int servovLimitHigh = 165;
int servovLimitLow = 25;
//DHT22 sensor
#define DHTPIN 46 // Digital pin connected to the DHT sensor
#define DHTTYPE DHT22 // DHT 22
DHT dht(DHTPIN, DHTTYPE);
// LDR pin connections
// name = analogpin;
int ldrlt = A12; //LDR top left - BOTTOM LEFT <--- BDG
int ldrrt = A8; //LDR top rigt - BOTTOM RIGHT
int ldrld = A6; //LDR down left - TOP LEFT
int ldrrd = A8; //ldr down rigt - TOP RIGHT
//this is for the rain sensor, pv and battery
int rainSensorPin,readRainSensor, battSensorPin, pvSensorPin, lt, rt, ld, rd;
float h, t, readPVsensor, readBattSensor;
int lumIntenLT, lumIntenRT, lumIntenLD, lumIntenRD, averageLumInten;
int ldrRes = 1000;
int ldrFixRes = 10000;
//for the PV voltage
// Floats for ADC voltage & Input voltage
float adc_voltage = 0.0;
float in_voltage = 0.0;
// Floats for resistor values in divider (in ohms)
float R1 = 2000.0;
float R2 = 10000.0;
// Float for Reference Voltage
float ref_voltage = 5.0;
// Integer for ADC value
int adc_value = 0;
//for Battery Level
// Floats for resistor values in divider (in ohms)
float R3 = 30000.0;
float R4 = 7500.0;
float adc_Battvoltage = 0.0;
float in_Battvoltage = 0.0;
int adc_Battvalue = 0;
const int ledPin = LED_BUILTIN; // the number of the LED pin
// Variables will change:
int ledState = LOW; // ledState used to set the LED
unsigned long previousMillis = 0; // will store last time LED was updated
// constants won't change:
const long interval = 200; // interval at which to blink (milliseconds)
float dht22Sensor() {
// Reading temperature or humidity takes about 250 milliseconds!
// Sensor readings may also be up to 2 seconds 'old' (its a very slow sensor)
h = dht.readHumidity();
// Read temperature as Celsius (the default)
t = dht.readTemperature();
// Read temperature as Fahrenheit (isFahrenheit = true)
float f = dht.readTemperature(true);
// Check if any reads failed and exit early (to try again).
if (isnan(h) || isnan(t) || isnan(f)) {
Serial.println(F("Failed to read from DHT sensor!"));
return;
}
// Compute heat index in Fahrenheit (the default)
float hif = dht.computeHeatIndex(f, h);
// Compute heat index in Celsius (isFahreheit = false)
float hic = dht.computeHeatIndex(t, h, false);
Serial.print(F("Humidity: "));
Serial.print(h);
Serial.print(F("% Temperature: "));
Serial.print(t);
Serial.print(F("°C "));
Serial.print(f);
Serial.print(F("°F Heat index: "));
Serial.print(hic);
Serial.print(F("°C "));
Serial.print(hif);
Serial.println(F("°F"));
return h, t;
}
int rainSenor() {
rainSensorPin = A0;
readRainSensor = analogRead(rainSensorPin);
Serial.print("Rain sensor: ");
Serial.println(readRainSensor);
return readRainSensor;
}
float pvVoltageLevel() {
pvSensorPin = A5;
readPVsensor = analogRead(pvSensorPin);
// Determine voltage at ADC input
adc_voltage = (readPVsensor * ref_voltage) / 1024.0;
// Calculate voltage at divider input
in_voltage = adc_voltage / (R2 / (R1 + R2));
Serial.print("PV Voltage Level: ");
Serial.println(in_voltage);
return in_voltage;
}
float battVoltageLevel() {
battSensorPin = A1;
readBattSensor = analogRead(battSensorPin);
// Determine voltage at ADC input
adc_Battvoltage = (readBattSensor * ref_voltage) / 1024.0;
// Calculate voltage at divider input
in_Battvoltage = adc_Battvoltage / (R4 / (R3 + R4));
Serial.print("Battery Voltage Level: ");
Serial.println(in_Battvoltage);
return in_Battvoltage;
}
int trackSun() {
lt = analogRead(ldrlt); // top left
rt = analogRead(ldrrt); // top right
ld = analogRead(ldrld); // down left
rd = analogRead(ldrrd); // down rigt
// int dtime = analogRead(4)/20; // read potentiometers
// int tol = analogRead(5)/4;
int dtime = 200;
int tol = 50;
int avt = (lt + rt) / 2; // average value top
int avd = (ld + rd) / 2; // average value down
int avl = (lt + ld) / 2; // average value left
int avr = (rt + rd) / 2; // average value right
int dvert = avt - avd; // check the diffirence of up and down
int dhoriz = avl - avr; // check the diffirence og left and rigt
averageLumInten = (avt + avd + avl + avr)/4;
Serial.print(avt);
Serial.print(" ");
Serial.print(avd);
Serial.print(" ");
Serial.print(avl);
Serial.print(" ");
Serial.print(avr);
Serial.print(" ");
Serial.print(dtime);
Serial.print(" ");
Serial.print(tol);
Serial.println(" ");
Serial.print("Average Lum ");
Serial.print(averageLumInten);
Serial.println(" ");
if (-1 * tol > dvert || dvert > tol) // check if the diffirence is in the tolerance else change vertical angle
{
if (avt > avd) {
servov = ++servov;
if (servov > servovLimitHigh) {
servov = servovLimitHigh;
}
} else if (avt < avd) {
servov = --servov;
if (servov < servovLimitLow) {
servov = servovLimitLow;
}
}
vertical.write(servov);
}
if (-1 * tol > dhoriz || dhoriz > tol) // check if the diffirence is in the tolerance else change horizontal angle
{
if (avl > avr) {
servoh = --servoh;
if (servoh < servohLimitLow) {
servoh = servohLimitLow;
}
} else if (avl < avr) {
servoh = ++servoh;
if (servoh > servohLimitHigh) {
servoh = servohLimitHigh;
}
} else if (avl = avr) {
// nothing
}
horizontal.write(servoh);
}
delay(dtime);
return averageLumInten;
}
void setup() {
Serial.begin(115200);
arduino.begin(115200);
dht.begin();
pinMode(ledPin, OUTPUT);
// servo connections
// name.attacht(pin);
horizontal.attach(7);
vertical.attach(6);
horizontal.write(40);
vertical.write(78);
delay(3000);
}
void loop() {
unsigned long currentMillis = millis();
if (currentMillis - previousMillis >= interval) {
// save the last time you blinked the LED
previousMillis = currentMillis;
// if the LED is off turn it on and vice-versa:
if (ledState == LOW) {
ledState = HIGH;
trackSun();
} else {
ledState = LOW;
sendData();
}
digitalWrite(ledPin, ledState);
}
}
void sendData(){
dht22Sensor();
rainSenor();
pvVoltageLevel();
battVoltageLevel();
arduino.print(h); arduino.print("A");
arduino.print(t); arduino.print("B");
arduino.print(averageLumInten); arduino.print("C");
arduino.print(readRainSensor); arduino.print("D");
arduino.print(in_voltage); arduino.print("E");
arduino.print(in_Battvoltage); arduino.print("F");
arduino.print("\n");
}
Explanation of The Arduino Source Code
This Arduino code is designed to manage various environmental sensors (DHT22, LDR, rain sensor) and control servo motors to track the sun. It uses a DHT22 sensor for measuring temperature and humidity, a rain sensor to detect moisture, and an LDR array for light intensity to track the sun’s position. The servos, controlled by horizontal and vertical angle adjustments, enable the system to orient itself towards the brightest light source, such as the sun. The code also includes logic for measuring photovoltaic (PV) and battery voltage levels, storing these values for further use.
In the setup() function, the serial communication is initialized, the DHT sensor is started, and the servo motors are attached to their respective pins. The servos are then set to predefined positions. The main logic resides in the loop() function, where the current system time is used to alternate between two tasks: tracking the sun by adjusting the servo angles based on light intensity data from the LDR sensors, and sending sensor data (temperature, humidity, light intensity, rain level, PV voltage, and battery voltage) to an external system via the SoftwareSerial interface.
The sendData() function collects the sensor readings, such as temperature, humidity, and voltage levels. This data is sent via serial communication using specific labels to indicate the different sensor values (A for humidity, B for temperature, etc.). The sun-tracking function calculates the average light intensity on different quadrants, and the servos adjust their angles accordingly to ensure maximum exposure to light. This design can be used for solar panel tracking systems or environmental monitoring applications.
Arduino Source Code for the ESP8266
#define CAYENNE_PRINT Serial
#include <SoftwareSerial.h>
// Redefine the domain BEFORE including the library.
#define CAYENNE_DOMAIN "mqtt.zafron.dev"
#include <CayenneMQTTESP8266.h>
#define rxPin 0 // GPIO0 (labelled IO0 on the ESP01), The actual Rx pin on ESP01 GPIO3,
#define txPin 2 //this is IO2 on the ESP01, the actual Tx pin on the ESP01 is GPIO1
#define pumpVirtualPin 1
SoftwareSerial nodeMCU(rxPin, txPin);
// WiFi network info.
char ssid[] = "Galaxy A51 917E";
char wifiPassword[] = "tosin@345";
// Zafron authentication info.
char username[] = "86c83916-675f-40e6-8b9a-89901f07d8bc";
char password[] = "000000007E162FE3";
char clientID[] = "F11B1035";
int Button;
char c;
String dataIn;
int8_t indexOfA, indexOfB,indexOfC,indexOfD, indexOfE, indexOfF;
String data1, data2, data3, data4, data5, data6;
float ch1, ch2, ch5, ch6;
int ch3, ch4;
void setup() {
randomSeed(analogRead(0));
Serial.begin(9600);
Cayenne.begin(username, password, clientID, ssid, wifiPassword);
nodeMCU.begin(115200);
}
void loop() {
Cayenne.loop();
}
// Default function for sending sensor data at intervals to Cayenne.
// You can also use functions for specific channels, e.g CAYENNE_OUT(1) for sending channel 1 data.
CAYENNE_OUT_DEFAULT(){
long RandomNumber;
RandomNumber = random(5);
RandomNumber *= 10;
RandomNumber /= 1.21;
Serial.print("PV Voltage: ");
Serial.println(RandomNumber);
recvData();
// Write data to Cayenne here. This example just sends the current uptime in milliseconds on virtual channel 0.
// Cayenne.virtualWrite(0, millis());
// Some examples of other functions you can use to send data.
Cayenne.virtualWrite(1, ch1, "Weather Humidity", "%");
Cayenne.celsiusWrite(2, ch2);
Cayenne.luxWrite(3, ch3);
Cayenne.virtualWrite(4, ch4, "Rain Sensor", "mmHg");
Cayenne.virtualWrite(5, ch5, "PV Voltage", "V");
Cayenne.virtualWrite(6, ch6, "Battery Voltage", "V");
Cayenne.virtualWrite(7, RandomNumber, "PV Current", "A");
delay(5000);
}
void recvData(){
while(nodeMCU.available() >0){
c = nodeMCU.read();
if( c == '\n'){
break;
}
else{
dataIn += c;
}
}
if(c == '\n'){
//Serial.println(c);
parse_data();
Serial.println("data 1= " + data1);
Serial.println("data 2= " + data2);
Serial.println("data 3= " + data3);
Serial.println("data 4= " + data4);
Serial.println("data 5= " + data5);
Serial.println("data 6= " + data6);
Serial.println("............................");
c = 0;
dataIn = "";
}
}
void parse_data(){
indexOfA = dataIn.indexOf("A");
indexOfB = dataIn.indexOf("B");
indexOfC = dataIn.indexOf("C");
indexOfD = dataIn.indexOf("D");
indexOfE = dataIn.indexOf("E");
indexOfF = dataIn.indexOf("F");
data1 = dataIn.substring(0, indexOfA);
data2 = dataIn.substring(indexOfA+1, indexOfB);
data3 = dataIn.substring(indexOfB+1, indexOfC);
data4 = dataIn.substring(indexOfC+1, indexOfD);
data5 = dataIn.substring(indexOfD+1, indexOfE);
data6 = dataIn.substring(indexOfE+1, indexOfF);
ch1 = data1.toFloat();
ch2 = data2.toFloat();
ch3 = data3.toInt();
ch4 = data4.toInt();
ch5 = data5.toFloat();
ch6 = data6.toFloat();
}
// Default function for processing actuator commands from the Cayenne Dashboard.
// You can also use functions for specific channels, e.g CAYENNE_IN(1) for channel 1 commands.
CAYENNE_IN_DEFAULT(){
CAYENNE_LOG("Channel %u, value %s", request.channel, getValue.asString());
//Process message here. If there is an error set an error message using getValue.setError(), e.g getValue.setError("Error message");
}
Testing and Monitoring the Solar Tracker
The solar tracker with weather station project design
The system responds to the direction of the sun by moving the solar panel to face the sun when the system is powered on. The sensors are made to be powered by the rechargeable batteries.
Once our solar tracker is up and running, we’ll want to monitor the data in real-time. The IoT platform we chose allowed us to track temperature, humidity, and rainfall remotely.
Troubleshooting Common Issues
Servo Motor Jitter
Servo motors may experience jittering if not properly powered or if the code isn’t optimized. Ensure your power supply is stable and check your servo code for smooth movement.
Conclusion
Building a solar tracker with integrated weather station monitoring is a great way to enhance the efficiency of solar energy systems while keeping tabs on environmental conditions. With components like the Arduino Mega, DHT22 sensor, and ESP8266-01 module, you can create a smart system that not only tracks the sun but also provides real-time weather data to an IoT platform. This project is a step towards creating more sustainable, energy-efficient systems that adapt to their surroundings.
Call to Action
Have questions about building your own solar tracker with weather monitoring? Leave a comment below! We’d love to hear your thoughts and ideas on making this project even better.
FAQs
What is the purpose of a solar tracker? A solar tracker increases the efficiency of solar panels by following the sun’s movement throughout the day, ensuring optimal sunlight exposure.
Why integrate a weather station into the solar tracker? Weather stations provide real-time data on environmental conditions like temperature, humidity, and rainfall, which can impact solar energy efficiency.
Can I use a different IoT platform than ESP8266-01? Yes, you can use platforms like Blynk, Adafruit IO, or ThingSpeak to monitor weather data and solar tracking remotely.
How do the servo motors adjust the solar panel’s position? The servo motors adjust the panel’s tilt and horizontal position based on the sun’s direction, optimizing exposure.
Can this system work in areas with frequent cloudy weather? Yes, the LiPo batteries provide backup power, and the system can still track and send data even when the sun isn’t fully visible.
Solar energy is one of the most accessible and environmentally friendly sources of power. However, capturing this energy efficiently requires a system that can follow the sun’s path, ensuring optimal exposure throughout the day. This is where a solar tracker comes in. In this article, we’ll walk you through building a solar tracker system integrated with weather station monitoring. The system will use an Arduino Mega to read weather sensors and control the orientation of a 10W solar panel to optimize sun exposure.
block diagram for the solar tracker with weather station design
A solar tracker is a device that orients solar panels toward the sun to maximize energy capture. Unlike static panels, solar trackers follow the sun’s movement, increasing the efficiency of solar energy collection by up to 30-50%.
The solar tracker with weather station project design
In this project, we enhance our solar tracker with weather station features. The system not only tracks the sun but also collects environmental data, providing real-time information on temperature, humidity, and rainfall.
Building your own solar tracker with weather station monitoring offers multiple benefits:
Increased Solar Efficiency: Solar panels follow the sun’s path for optimal exposure.
Real-time Weather Monitoring: Get live updates on the environmental conditions affecting your solar system.
Educational Experience: This project offers an opportunity to learn about solar energy, electronics, and IoT integration.
Materials and Components Needed
For this project, here’s a list of all the components and modules we used:
Arduino Mega 2560 Compact Board Type: Acts as the brain of the system, reading sensors and controlling servos. You can also use any other Arduino board of your choice. We found that this was cheaper and provided us with the needed IO pins we needed in the project design.
10W Solar Panel: This is the panel that will follow the sun’s movement. It is also used to charge the backup battery using a DC-DC buck converter or a LiPo charging module.
DHT22 Sensor: Measures temperature and humidity. We needed to measure the atmospheric temperature and the humidity. Hence we implored this module for that job.
Rain Sensor Module: Detects rainfall and alerts the system. We used this to know when there is rain drops or simulate the advent of rain fall for the solar tracker with weather station design.
2 Servo Motors: Used to adjust the position of the solar panel. The directional movement of the solar panel in the horizontal and vertical directions are actually done by these pair. One of these is responsible for the vertical movement while the other the horizontal rotation.
ESP8266-01 Module (Optional): For sending data to an IoT platform. Since We included an upgrade of IoT to the project, We used the ESP-01 module to send the readings to the Zafron IoT dashboard. However, you can add a display screen and save yourself this hassle.
DC-DC Buck Converter: Used to regulate the voltage for the Arduino and other components.
3.7V LiPo Batteries (2x): Backup power source to ensure the system runs even during cloudy conditions.
Connecting Wires, female header pin, connectors and Other Connecting Materials: Essential for wiring and connecting components.
In this project, we are building a dual-axis solar tracker, which allows movement in two directions: horizontal and vertical. This ensures that the solar panel can follow the sun as it moves from east to west, and also adjusts its tilt as the sun’s angle changes throughout the day.
Solar Tracker With Weather Station: The Schematic Diagram
The Schematic Diagram of Solar Tracker With Weather Station
Explanation of the The Schematic Diagram of Solar Tracker With Weather Station
Attaching the Servo Motors
We needed two servo motors—one to control the horizontal movement and another to control the tilt. According to the schematic diagram above, here’s how to wire the servos to the Arduino Mega:
Servo 1 (Horizontal): Connect the signal pin to pin 10 on the Arduino.
Servo 2 (Vertical): Connect the signal pin to pin 11 on the Arduino.
We powered the servos using the 5V from the DC-DC buck converter.
The DHT22 sensor will be used to measure the temperature and humidity of the environment. Here’s how we wired it:
VCC: Connect to 5V on the Arduino.
GND: Connect to Ground.
DATA: Connect to pin D47 on the Arduino.
Wiring the Rain Sensor
The rain sensor detects the presence of rainfall. This sensor will be particularly useful in conditions where solar energy collection is reduced due to rain. Here’s the wiring:
Measuring Voltage and Current of The PV and Battery
We included two sensors, the voltage sensor module and the current sensor module to measure the voltage and current of the solar panel that is being dissipated onto the batteries. We used the whole project as an entire load for the current sensor module.
Programming the Arduino Mega 2560
Once everything is wired, it’s time to write the Arduino code. We used the following Arduino code:
#include <Servo.h> // include Servo library
#include "DHT.h" // include the DHT22 sensor lib
#include <SoftwareSerial.h>
SoftwareSerial arduino(30, 28);// hardware Rx<=>D26, hardware Tx<=>31, IO0 <=>D28, IO2<=>D30
// 180 horizontal MAX
Servo horizontal; // horizontal servo
int servoh = 45; // 90; // stand horizontal servo
int servohLimitHigh = 120;
int servohLimitLow = 10;
// 65 degrees MAX
Servo vertical; // vertical servo
int servov = 45; // 90; // stand vertical servo
int servovLimitHigh = 165;
int servovLimitLow = 25;
//DHT22 sensor
#define DHTPIN 46 // Digital pin connected to the DHT sensor
#define DHTTYPE DHT22 // DHT 22
DHT dht(DHTPIN, DHTTYPE);
// LDR pin connections
// name = analogpin;
int ldrlt = A12; //LDR top left - BOTTOM LEFT <--- BDG
int ldrrt = A8; //LDR top rigt - BOTTOM RIGHT
int ldrld = A6; //LDR down left - TOP LEFT
int ldrrd = A8; //ldr down rigt - TOP RIGHT
//this is for the rain sensor, pv and battery
int rainSensorPin,readRainSensor, battSensorPin, pvSensorPin, lt, rt, ld, rd;
float h, t, readPVsensor, readBattSensor;
int lumIntenLT, lumIntenRT, lumIntenLD, lumIntenRD, averageLumInten;
int ldrRes = 1000;
int ldrFixRes = 10000;
//for the PV voltage
// Floats for ADC voltage & Input voltage
float adc_voltage = 0.0;
float in_voltage = 0.0;
// Floats for resistor values in divider (in ohms)
float R1 = 2000.0;
float R2 = 10000.0;
// Float for Reference Voltage
float ref_voltage = 5.0;
// Integer for ADC value
int adc_value = 0;
//for Battery Level
// Floats for resistor values in divider (in ohms)
float R3 = 30000.0;
float R4 = 7500.0;
float adc_Battvoltage = 0.0;
float in_Battvoltage = 0.0;
int adc_Battvalue = 0;
const int ledPin = LED_BUILTIN; // the number of the LED pin
// Variables will change:
int ledState = LOW; // ledState used to set the LED
unsigned long previousMillis = 0; // will store last time LED was updated
// constants won't change:
const long interval = 200; // interval at which to blink (milliseconds)
float dht22Sensor() {
// Reading temperature or humidity takes about 250 milliseconds!
// Sensor readings may also be up to 2 seconds 'old' (its a very slow sensor)
h = dht.readHumidity();
// Read temperature as Celsius (the default)
t = dht.readTemperature();
// Read temperature as Fahrenheit (isFahrenheit = true)
float f = dht.readTemperature(true);
// Check if any reads failed and exit early (to try again).
if (isnan(h) || isnan(t) || isnan(f)) {
Serial.println(F("Failed to read from DHT sensor!"));
return;
}
// Compute heat index in Fahrenheit (the default)
float hif = dht.computeHeatIndex(f, h);
// Compute heat index in Celsius (isFahreheit = false)
float hic = dht.computeHeatIndex(t, h, false);
Serial.print(F("Humidity: "));
Serial.print(h);
Serial.print(F("% Temperature: "));
Serial.print(t);
Serial.print(F("°C "));
Serial.print(f);
Serial.print(F("°F Heat index: "));
Serial.print(hic);
Serial.print(F("°C "));
Serial.print(hif);
Serial.println(F("°F"));
return h, t;
}
int rainSenor() {
rainSensorPin = A0;
readRainSensor = analogRead(rainSensorPin);
Serial.print("Rain sensor: ");
Serial.println(readRainSensor);
return readRainSensor;
}
float pvVoltageLevel() {
pvSensorPin = A5;
readPVsensor = analogRead(pvSensorPin);
// Determine voltage at ADC input
adc_voltage = (readPVsensor * ref_voltage) / 1024.0;
// Calculate voltage at divider input
in_voltage = adc_voltage / (R2 / (R1 + R2));
Serial.print("PV Voltage Level: ");
Serial.println(in_voltage);
return in_voltage;
}
float battVoltageLevel() {
battSensorPin = A1;
readBattSensor = analogRead(battSensorPin);
// Determine voltage at ADC input
adc_Battvoltage = (readBattSensor * ref_voltage) / 1024.0;
// Calculate voltage at divider input
in_Battvoltage = adc_Battvoltage / (R4 / (R3 + R4));
Serial.print("Battery Voltage Level: ");
Serial.println(in_Battvoltage);
return in_Battvoltage;
}
int trackSun() {
lt = analogRead(ldrlt); // top left
rt = analogRead(ldrrt); // top right
ld = analogRead(ldrld); // down left
rd = analogRead(ldrrd); // down rigt
// int dtime = analogRead(4)/20; // read potentiometers
// int tol = analogRead(5)/4;
int dtime = 200;
int tol = 50;
int avt = (lt + rt) / 2; // average value top
int avd = (ld + rd) / 2; // average value down
int avl = (lt + ld) / 2; // average value left
int avr = (rt + rd) / 2; // average value right
int dvert = avt - avd; // check the diffirence of up and down
int dhoriz = avl - avr; // check the diffirence og left and rigt
averageLumInten = (avt + avd + avl + avr)/4;
Serial.print(avt);
Serial.print(" ");
Serial.print(avd);
Serial.print(" ");
Serial.print(avl);
Serial.print(" ");
Serial.print(avr);
Serial.print(" ");
Serial.print(dtime);
Serial.print(" ");
Serial.print(tol);
Serial.println(" ");
Serial.print("Average Lum ");
Serial.print(averageLumInten);
Serial.println(" ");
if (-1 * tol > dvert || dvert > tol) // check if the diffirence is in the tolerance else change vertical angle
{
if (avt > avd) {
servov = ++servov;
if (servov > servovLimitHigh) {
servov = servovLimitHigh;
}
} else if (avt < avd) {
servov = --servov;
if (servov < servovLimitLow) {
servov = servovLimitLow;
}
}
vertical.write(servov);
}
if (-1 * tol > dhoriz || dhoriz > tol) // check if the diffirence is in the tolerance else change horizontal angle
{
if (avl > avr) {
servoh = --servoh;
if (servoh < servohLimitLow) {
servoh = servohLimitLow;
}
} else if (avl < avr) {
servoh = ++servoh;
if (servoh > servohLimitHigh) {
servoh = servohLimitHigh;
}
} else if (avl = avr) {
// nothing
}
horizontal.write(servoh);
}
delay(dtime);
return averageLumInten;
}
void setup() {
Serial.begin(115200);
arduino.begin(115200);
dht.begin();
pinMode(ledPin, OUTPUT);
// servo connections
// name.attacht(pin);
horizontal.attach(7);
vertical.attach(6);
horizontal.write(40);
vertical.write(78);
delay(3000);
}
void loop() {
unsigned long currentMillis = millis();
if (currentMillis - previousMillis >= interval) {
// save the last time you blinked the LED
previousMillis = currentMillis;
// if the LED is off turn it on and vice-versa:
if (ledState == LOW) {
ledState = HIGH;
trackSun();
} else {
ledState = LOW;
sendData();
}
digitalWrite(ledPin, ledState);
}
}
void sendData(){
dht22Sensor();
rainSenor();
pvVoltageLevel();
battVoltageLevel();
arduino.print(h); arduino.print("A");
arduino.print(t); arduino.print("B");
arduino.print(averageLumInten); arduino.print("C");
arduino.print(readRainSensor); arduino.print("D");
arduino.print(in_voltage); arduino.print("E");
arduino.print(in_Battvoltage); arduino.print("F");
arduino.print("\n");
}
Explanation of The Arduino Source Code
This Arduino code is designed to manage various environmental sensors (DHT22, LDR, rain sensor) and control servo motors to track the sun. It uses a DHT22 sensor for measuring temperature and humidity, a rain sensor to detect moisture, and an LDR array for light intensity to track the sun’s position. The servos, controlled by horizontal and vertical angle adjustments, enable the system to orient itself towards the brightest light source, such as the sun. The code also includes logic for measuring photovoltaic (PV) and battery voltage levels, storing these values for further use.
In the setup() function, the serial communication is initialized, the DHT sensor is started, and the servo motors are attached to their respective pins. The servos are then set to predefined positions. The main logic resides in the loop() function, where the current system time is used to alternate between two tasks: tracking the sun by adjusting the servo angles based on light intensity data from the LDR sensors, and sending sensor data (temperature, humidity, light intensity, rain level, PV voltage, and battery voltage) to an external system via the SoftwareSerial interface.
The sendData() function collects the sensor readings, such as temperature, humidity, and voltage levels. This data is sent via serial communication using specific labels to indicate the different sensor values (A for humidity, B for temperature, etc.). The sun-tracking function calculates the average light intensity on different quadrants, and the servos adjust their angles accordingly to ensure maximum exposure to light. This design can be used for solar panel tracking systems or environmental monitoring applications.
Testing and Monitoring the Solar Tracker
The solar tracker with weather station project design
The system responds to the direction of the sun by moving the solar panel to face the sun when the system is powered on. The sensors are made to be powered by the rechargeable batteries.
Once our solar tracker is up and running, we’ll want to monitor the data in real-time. The IoT platform we chose allowed us to track temperature, humidity, and rainfall remotely.
Troubleshooting Common Issues
Servo Motor Jitter
Servo motors may experience jittering if not properly powered or if the code isn’t optimized. Ensure your power supply is stable and check your servo code for smooth movement.
Conclusion
Building a solar tracker with integrated weather station monitoring is a great way to enhance the efficiency of solar energy systems while keeping tabs on environmental conditions. With components like the Arduino Mega, DHT22 sensor, and ESP8266-01 module, you can create a smart system that not only tracks the sun but also provides real-time weather data to an IoT platform. This project is a step towards creating more sustainable, energy-efficient systems that adapt to their surroundings.
Call to Action
Have questions about building your own solar tracker with weather monitoring? Leave a comment below! We’d love to hear your thoughts and ideas on making this project even better.
FAQs
What is the purpose of a solar tracker? A solar tracker increases the efficiency of solar panels by following the sun’s movement throughout the day, ensuring optimal sunlight exposure.
Why integrate a weather station into the solar tracker? Weather stations provide real-time data on environmental conditions like temperature, humidity, and rainfall, which can impact solar energy efficiency.
Can I use a different IoT platform than ESP8266-01? Yes, you can use platforms like Blynk, Adafruit IO, or ThingSpeak to monitor weather data and solar tracking remotely.
How do the servo motors adjust the solar panel’s position? The servo motors adjust the panel’s tilt and horizontal position based on the sun’s direction, optimizing exposure.
Can this system work in areas with frequent cloudy weather? Yes, the LiPo batteries provide backup power, and the system can still track and send data even when the sun isn’t fully visible.
In today’s world, livestock farming is a critical sector that drives food production. However, managing livestock health and safety can be challenging, especially with large herds scattered across vast areas. Traditional methods for monitoring livestock can be inefficient and costly, which is why technology offers an innovative solution. With advancements in microcontrollers and IoT, it is now possible to track livestock using smart devices. In this post, we explore a project that utilizes Arduino, LoRa, GPS, and sensors to create a comprehensive livestock tracking system. This system not only monitors location but also keeps track of the animal’s health, sending real-time alerts to the owner.
What Is a Smart Livestock Tracking System?
A smart livestock tracking system integrates various sensors and communication modules to provide real-time information about livestock, including their location, health parameters, and environmental conditions. The system discussed in this bpost uses Arduino Nano, LoRa modules, GPS, and GSM technology, along with sensors like DHT11 (for temperature and humidity) and a pulse rate sensor.
Smart livestock tracking with health monitoring project design
The system collects data from these sensors, processes it, and sends alerts via SMS if the animal’s health conditions become abnormal. The information is also transmitted via LoRa technology to a receiver that displays it on an LCD screen, making it easier for farmers to monitor their livestock remotely.
Components/Modules for Livestock Tracking Project Design
To build this livestock tracker, we utilized several essential components, each contributing to the system’s functionality. Let’s break down each of these:
Arduino Nano
The Arduino Nano board
The Arduino Nano is the core microcontroller that runs the entire system. It processes data from the sensors and controls communication between the GPS, GSM, and LoRa modules. Due to its compact size and low power consumption, the Nano is ideal for this application.
The GPS module, Neo-6M used for the livestock tracking project
The Neo-6M GPS module provides accurate geolocation data. In this system, the GPS module tracks the livestock’s location in terms of latitude and longitude, which is sent to the owner via SMS. GPS tracking is crucial for preventing livestock theft or tracking animals that have wandered off.
LoRa 433MHz Modules
SX1278 LoRa Module 433MHz 10KM Original Ra-02 Ai-Thinker Wireless Module with Antenna
LoRa (Long Range) modules enable wireless communication between the transmitter (on the livestock) and the receiver (with the farmer). The 433MHz LoRa modules have a range of up to 10 km, making them perfect for transmitting data across large farms.
SIM800 EVB GSM Module
The SIM800 EVB GSM module sends SMS alerts with the GPS location and health status of the livestock. It provides the farmer with real-time updates through text messages, including Google Maps links with the animal’s exact location.
DHT11 Sensor
DHT11 sensor
The DHT11 sensor measures both temperature and humidity. This sensor monitors the livestock’s environmental conditions, ensuring that animals are not exposed to extreme temperatures or humidity levels that could affect their health.
Pulse Rate Sensor
heart shaped pulse sensor module
The pulse rate sensor is designed to measure the animal’s heart rate. Abnormal pulse rates can be an indication of stress or illness, and this data is crucial for early intervention.
3.7V LiPo Rechargeable Battery
3.7V Li-Ion rechargeable battery used for the smart livestock tracking project design
A 3.7V LiPo battery powers the entire system, making it portable and easy to attach to the animal’s collar or harness.
Piezo Buzzer
piezo buzzer
A piezo buzzer attached to the receiver alerts the farmer when an abnormal reading is detected. This provides an additional layer of notification beyond the SMS alerts.
The system is designed to be both efficient and practical. Here’s how it works, from powering on to sending real-time alerts:
Powering the Transmitter
Once the transmitter side of the system, which is attached to the livestock, is powered on using the rechargeable LiPo battery, the GSM module automatically connects to the network.
Location Tracking via GPS
The GPS module kicks in and starts gathering the current location of the animal. The data it collects includes latitude and longitude, which are crucial for tracking the animal in real-time. This data is sent periodically to the GSM module.
Health Monitoring with DHT11 and Pulse Rate Sensor
The DHT11 sensor continuously measures the temperature and humidity surrounding the animal. Simultaneously, the pulse rate sensor monitors the animal’s heart rate. These sensors ensure the animal’s environment and health are within safe limits.
Data Transmission via LoRa
When the sensors detect normal conditions, the data (location, temperature, humidity, and pulse rate) is sent via the LoRa module to the receiver. The receiver displays this information on a 20×4 LCD screen, allowing the farmer to monitor the data in real-time.
Abnormal Condition Alerts
If any of the sensors detect abnormal conditions, such as extreme temperatures, high humidity, or an irregular pulse rate, an alert is triggered. The GSM module immediately sends an SMS to the owner, which includes the current GPS location of the animal in the form of a Google Maps link, along with details about the abnormal condition.
The SMS alert Sent to the receiver
Simultaneously, the LoRa module transmits the alert to the receiver, where a piezo buzzer sounds to indicate that something is wrong. The farmer can then take immediate action to check on the livestock.
Schematic diagram of Smart livestock tracker project design, the transmitter side
The schematic diagram shown above shows the connection of the various sensors and modules connected to the Arduino Nano board. The GPS module is connected via serial communication with the Arduino Nano. And the GSM module connected via hardware serial communication.
Explanation of The Smart Livestock Tracker Schematic Diagram (The Transmitter Side)
We added the non-contact temperature sensor module MLX90614 to the mix to be able to take the body temperature of the livestock. This sensor works on 3.3V so we connected it to the 3.3V voltage output power rail on the Arduino Nano board.
The DHT11 sensor was used to measure the surrounding temperature and humidity around the livestock itself and since we were using the sensor version of DHT11, we added a 10k resistor between the Digital output pin of the sensor and the power pin. The system was power by a rechargeable battery and we included a charging port for this. Also, the module allowed us to take a 5V from the 3.7V battery.
Explanation of The Smart Livestock Tracker Schematic Diagram (The Receiver Side)
We used the LCD to display what the transmitter side is seeing and measuring. And the setup above shows that we also used a rechargeable battery to make the system energy sustainable too. The LoRa module receives the messages sent by the transmitter and the LCD displays it.
Assembling The Smart Livestock Tracker Project Design: A Step-by-Step Guide
Now that we’ve discussed the components and how the system works, let’s walk through the setup process:
Assembling the Transmitter
Begin by connecting the Neo-6M GPS module, DHT11 sensor, pulse rate sensor, LoRa module, and SIM800 GSM module to the Arduino Nano on the transmitter side.
Ensure that the LiPo battery is properly connected to provide a steady power supply.
Setting Up the Receiver
On the receiver side, connect the LoRa module and LCD screen to the Arduino Nano.
Attach a piezo buzzer to sound an alert or add two LED indicators, a green LED blinks to show normal conditions and a Red LED that blinks when abnormal conditions are detected.
Programming the Arduino
The Arduino Transmitter Code
#include <SPI.h>
#include <LoRa.h>
#include "DHT.h"
#include <Adafruit_MLX90614.h>
#include <TinyGPS++.h>
#include <SoftwareSerial.h>
#include <SerialGSM.h>
// Choose two Arduino pins to use for software serial
int RXPin = 3;
int TXPin = 4;
int GPSBaud = 9600;
// Create a TinyGPS++ object
TinyGPSPlus gps;
String latitude = "";
String longitude = "";
String message = "";
// Create a software serial port called "gpsSerial"
SoftwareSerial gpsSerial(RXPin, TXPin);
Adafruit_MLX90614 mlx = Adafruit_MLX90614();
// Digital pin connected to the DHT sensor
#define DHTPIN 5
String SMS;
int counter, sensorPin = 0;
bool panic;
float h, t, f, animalBodyTemp;
int sensorAnalog,heartRate, checkHBP, checkLBP = 0;
String greeting = "hello";
// DHT 11
#define DHTTYPE DHT11
// as the current DHT reading algorithm adjusts itself to work on faster procs.
DHT dht(DHTPIN, DHTTYPE);
void loraSetup(){
while (!Serial);
Serial.println("LoRa Sender");
//replace the LoRa.begin(---E-) argument with your location's frequency
//433E6 for Africa & Asia
//866E6 for Europe
//915E6 for North America
while (!LoRa.begin(433E6)) {
Serial.println(".");
delay(500);
}
// Change sync word (0xF4) to match the receiver
// The sync word assures you don't get LoRa messages from other LoRa transceivers
// ranges from 0-0xFF
LoRa.setSyncWord(0xF4);
Serial.println("LoRa Initializing OK!");
}
void setup() {
//initialize Serial Monitor
Serial.begin(9600);
//begin the dht sensor
dht.begin();
//start the LoRa setup
loraSetup();
if (!mlx.begin()) {
Serial.println("Error connecting to MLX sensor. Check wiring.");
while (1);
}
// Start the software serial port at the GPS's default baud
gpsSerial.begin(GPSBaud);
//set ur inputs and outouts make the buzzer an output
// pinMode(buzzerPin, OUTPUT);
//pinMode(HBPpin, INPUT_PULLUP);
//pinMode(LBPpin, INPUT_PULLUP);
}
float dhtSensor(){
// Reading temperature or humidity takes about 250 milliseconds!
// Sensor readings may also be up to 2 seconds 'old' (its a very slow sensor)
h = dht.readHumidity();
// Read temperature as Celsius (the default)
t = dht.readTemperature();
// Read temperature as Fahrenheit (isFahrenheit = true)
f = dht.readTemperature(true);
return h, t, f;
// Check if any reads failed and exit early (to try again).
if (isnan(h) || isnan(t) || isnan(f)) {
Serial.println(F("Failed to read from DHT sensor!"));
}
// Compute heat index in Fahrenheit (the default)
float hif = dht.computeHeatIndex(f, h);
// Compute heat index in Celsius (isFahreheit = false)
float hic = dht.computeHeatIndex(t, h, false);
}
float mlxTempSensor(){
animalBodyTemp = mlx.readObjectTempC();
return animalBodyTemp;
}
int pulseSensor(){
sensorPin = analogRead(A3);
sensorPin = map(sensorPin, 1, 1023, 0, 100);
sensorPin = constrain(sensorPin, 1, 100);
return sensorPin;
}
String displayInfo(){
if (gps.location.isValid()){
latitude = String(gps.location.lat(), 6);
longitude = String(gps.location.lng(), 6);
//message = "";
message = "https://www.google.com/maps/place/" + String(gps.location.lat(), 6) + "," + String(gps.location.lng(), 6);
}
else{
Serial.println("Location: Not Available");
}
Serial.print("Date: ");
if (gps.date.isValid()){
Serial.print(gps.date.month());
Serial.print("/");
Serial.print(gps.date.day());
Serial.print("/");
Serial.println(gps.date.year());
}
else{
Serial.println("Not Available");
}
Serial.print("Time: ");
if (gps.time.isValid()){
if (gps.time.hour() < 10) Serial.print(F("0"));
Serial.print(gps.time.hour());
Serial.print(":");
if (gps.time.minute() < 10) Serial.print(F("0"));
Serial.print(gps.time.minute());
Serial.print(":");
if (gps.time.second() < 10) Serial.print(F("0"));
Serial.print(gps.time.second());
Serial.print(".");
if (gps.time.centisecond() < 10) Serial.print(F("0"));
Serial.println(gps.time.centisecond());
}
else{
Serial.println("Not Available");
}
Serial.println();
delay(1000);
return latitude, longitude, message;
}
void checkGPS(){
// This sketch displays information every time a new sentence is correctly encoded.
while (gpsSerial.available() > 0)
if (gps.encode(gpsSerial.read()))
displayInfo();
// If 5000 milliseconds pass and there are no characters coming in
// over the software serial port, show a "No GPS detected" error
if (millis() > 5000 && gps.charsProcessed() < 10){
Serial.println("No GPS detected");
while(true);
}
}
void sendSMS(){
dhtSensor();
mlxTempSensor();
checkGPS();
if((t >= 34.80) || (animalBodyTemp >= 40.00) ){
Serial.println("AT"); //Once the handshake test is successful, it will back to OK
updateSerial();
Serial.println("AT+CMGF=1"); // Configuring TEXT mode
updateSerial();
Serial.println("AT+CMGS=\"+2348062020050\"\r\n");//change ZZ with country code and xxxxxxxxxxx with phone number to sms
updateSerial();
Serial.print("Hello sir, Hum: " + String(h) + " Room Temp: " + String(t) + "'C " + "Body Temp: " + String(animalBodyTemp)+ "Location: " + message); //text content
updateSerial();
Serial.write(26);
delay(5000);
sendSMS1();
}
else{
Serial.println("All good") ;
}
}
void sendSMS1(){
Serial.println("AT"); //Once the handshake test is successful, it will back to OK
updateSerial();
Serial.println("AT+CMGF=1"); // Configuring TEXT mode
updateSerial();
Serial.println("AT+CMGS=\"+2348103131467\"\r\n");//change ZZ with country code and xxxxxxxxxxx with phone number to sms
updateSerial();
Serial.print("Hello sir, Hum: " + String(h) + " Room Temp: " + String(t) + "'C " + "Body Temp: " + String(animalBodyTemp)+ "Location: " + message); //text content
updateSerial();
Serial.write(26);
}
void sendTruLoRa(){
sendSMS();
pulseSensor();
Serial.println("<<<Sending packet>>>");
Serial.print("hum: ");Serial.print(h);
Serial.print(" temp: "); Serial.print(t);
Serial.print(" Animal B.Temp: ");
Serial.print(animalBodyTemp);
Serial.print(" Pulse Rate: ");
Serial.println(sensorPin);
Serial.print(" GSP coordinates: ");
Serial.println(message);
delay(1000);
//Send LoRa packet to receiver
LoRa.beginPacket();
//use delimiters
LoRa.print('<');
LoRa.print(greeting); LoRa.print(',');
LoRa.print(h);LoRa.print(',');
LoRa.print(t);LoRa.print(',');
LoRa.print(animalBodyTemp);LoRa.print(',');
LoRa.print(sensorPin);
LoRa.print('>');
LoRa.endPacket();
}
void loop() {
sendTruLoRa();
}
void updateSerial(){
delay(500);
while (Serial.available()) {
Serial.print(Serial.read());//Forward what Serial received to Software Serial Port
}
while(Serial.available())
{
Serial.write(Serial.read());//Forward what Software Serial received to Serial Port
}
}
Explanation of The Arduino Code
The code utilizes various sensors to gather information. It reads humidity and temperature using a DHT sensor, detects animal body temperature with an MLX sensor, and retrieves GPS coordinates through a software serial connection. Additionally, it seems to have provisions (though not actively used) for reading pulse rate and monitoring high/low blood pressure (sensors not included in the provided code).
The code transmits collected data (humidity, temperature, animal body temperature, pulse rate – if implemented, and GPS coordinates) via LoRa technology. It also checks for specific conditions, like high room temperature or animal body temperature. If these thresholds are exceeded, the code sends SMS alerts with the sensor readings and location information to two pre-defined phone numbers.
The Arduino Receiver Code
// include the library code:
#include <LiquidCrystal.h>
//include the LoRa libs
#include <SPI.h>
#include <LoRa.h>
// initialize the library by associating any needed LCD interface pin
// with the arduino pin number it is connected to
const int rs = A2, en = A1, d4 = 7, d5 = 6, d6 = 5, d7 = 4;
LiquidCrystal lcd(rs, en, d4, d5, d6, d7);
const byte numChars = 32;
char receivedChars[numChars];
char tempChars[numChars]; // temporary array for use when parsing
// variables to hold the parsed data
char messageFromPC[numChars] = {0};
float humidity, temperature, longi, lat, bodyTemp = 0.0;
int x, y, z = 0;
boolean newData = false;
static boolean recvInProgress = false;
static byte ndx = 0;
char startMarker = '<';
char endMarker = '>';
char rc;
#define ledPin 3
int ledState = LOW; // ledState used to set the LED
// Generally, you should use "unsigned long" for variables that hold time
// The value will quickly become too large for an int to store
unsigned long previousMillis = 0; // will store last time LED was updated
// constants won't change:
const long interval = 1000; // interval at which to blink (milliseconds)
void setup() {
Serial.begin(9600);
pinMode(ledPin, OUTPUT);
//begin the lcd module
lcd.begin(20, 4);
// Print a message to the LCD.
lcd.setCursor(2,0);
lcd.print(" HELLO MAERO");
lcd.setCursor(2, 1);
lcd.print("LIVESTOCK TRACKER");
delay(3000);
lcd.clear();
lcd.setCursor(4,0);
lcd.print(" PROJECT");
lcd.setCursor(1, 1);
lcd.print(" RECEIVER SIDE");
delay(3000);
lcd.clear();
while (!Serial);
Serial.println("LoRa Receiver");
if (!LoRa.begin(433E6)) {
Serial.println("Starting LoRa failed!");
while (1);
}
LoRa.setSyncWord(0xF4);
Serial.println("LoRa Initializing OK!");
}
void loop() {
blinkLED();
// try to parse packet
int packetSize = LoRa.parsePacket();
if (packetSize) {
// received a packet
Serial.println("<<<Received packet>>>");
// read packet
while (LoRa.available()) {
recvWithStartEndMarkers();
if (newData == true) {
strcpy(tempChars, receivedChars);
// this temporary copy is necessary to protect the original data
// because strtok() used in parseData() replaces the commas with \0
parseData();
showParsedData();
newData = false;
}
}
}
}
void blinkLED(){
unsigned long currentMillis = millis();
if (currentMillis - previousMillis >= interval) {
// save the last time you blinked the LED
previousMillis = currentMillis;
// if the LED is off turn it on and vice-versa:
if (ledState == LOW) {
ledState = HIGH;
} else {
ledState = LOW;
}
// set the LED with the ledState of the variable:
digitalWrite(ledPin, ledState);
}
}
void recvWithStartEndMarkers() {
while (LoRa.available() > 0 && newData == false) {
rc = LoRa.read();
if (recvInProgress == true) {
if (rc != endMarker) {
receivedChars[ndx] = rc;
ndx++;
if (ndx >= numChars) {
ndx = numChars - 1;
}
}
else {
receivedChars[ndx] = '\0'; // terminate the string
recvInProgress = false;
ndx = 0;
newData = true;
}
}
else if (rc == startMarker) {
recvInProgress = true;
}
}
}
//============
void parseData() { // split the data into its parts
char * strtokIndx; // this is used by strtok() as an index
strtokIndx = strtok(tempChars,","); // get the first part - the string
strcpy(messageFromPC, strtokIndx); // copy it to messageFromPC
strtokIndx = strtok(NULL, ","); // this continues where the previous call left off
humidity = atof(strtokIndx);
strtokIndx = strtok(NULL, ",");
temperature = atof(strtokIndx); // convert this part to a float
strtokIndx = strtok(NULL, ","); // this continues where the previous call left off
bodyTemp = atof(strtokIndx); // convert this part to an integer
strtokIndx = strtok(NULL, ","); // this continues where the previous call left off
x = atoi(strtokIndx); // convert this part to an integer
}
//============
void showParsedData() {
Serial.print(" Humidity: ");
Serial.println(humidity);
Serial.print(" Temperature: ");
Serial.println(temperature);
Serial.print(" Heart Rate: ");
Serial.println(x);
lcd.clear();
lcd.setCursor(0,0);
lcd.print("Humidity: " + String(humidity) + "%");
lcd.setCursor(0, 1);
lcd.print("Temperature: " + String(temperature) + "'C");
lcd.setCursor(0, 2);
lcd.print("B. Temp: " + String(bodyTemp) + "'C");
lcd.setCursor(0, 3);
lcd.print("Pulse Rate: " + String(x) + "bpm");
}
Explanation of Code
Setup:
Initializes serial communication and an LCD display.
Sets up LoRa communication for receiving data at a specific frequency (433E6 in this case).
Displays a welcome message and project information on the LCD screen.
Data Reception and Processing:
The code continuously checks for incoming LoRa packets.
It utilizes a function called recvWithStartEndMarkers to efficiently receive data packets containing a specific start and end marker (< and >).
Once a complete packet is received, the code parses the data using the parseData function. This function separates the received comma-delimited string into individual variables like humidity, temperature, body temperature, and heart rate (represented by “x” in the code).
Data Display:
The code updates the LCD display with the received sensor readings: humidity, temperature, body temperature, and heart rate. Parsed data is printed on the serial monitor for debugging purposes.
Testing the System
Testing the Smart livestock tracking project design
We powered on the transmitter and receiver modules and ensured that data is being sent and received correctly. We also simulated abnormal conditions (e.g., by changing the temperature or pulse rate) to test if the system sends alerts as expected. And it did.
Applications of Smart Livestock Tracking
This system has numerous applications in livestock management:
Preventing Livestock Theft: By providing real-time GPS data, the system can help farmers quickly locate and recover stolen animals.
Health Monitoring: The DHT11 and pulse rate sensors ensure that the animal’s health is monitored continuously. Early detection of stress or illness can save the lives of valuable livestock.
Remote Monitoring: The LoRa and GSM modules enable remote monitoring, meaning farmers don’t need to be physically present to ensure the well-being of their animals.
Advantages of Using IoT in Livestock Management
1. Cost-Effective
Using IoT-based systems like this one is cost-effective in the long run. It reduces the need for manual labor and helps prevent the loss of livestock due to theft or illness.
2. Real-Time Data
Farmers get real-time data on their animals’ location and health, allowing them to make informed decisions quickly.
3. Scalability
This system is scalable, meaning multiple livestock can be tracked simultaneously by adding more transmitters.
Challenges and Future Improvements
While the current system is highly functional, there are a few challenges to address:
Battery Life: The LiPo battery powering the transmitter needs to be recharged periodically. Using a solar panel to recharge the battery could enhance the system’s autonomy.
Data Accuracy: While the GPS module provides accurate location data, its performance can be affected by environmental factors such as dense foliage or extreme weather. Using more advanced GPS modules could improve reliability.
Range of LoRa: The LoRa module’s range is sufficient for most farms, but larger operations may require multiple receivers to cover more ground.
Conclusion
The Smart Livestock Tracker using Arduino, LoRa, and GPS is a powerful tool for modern livestock management. With real-time tracking and health monitoring capabilities, it allows farmers to protect their animals, ensure their well-being, and operate more efficiently. As IoT continues to evolve, systems like this one will become even more integral to the future of farming, offering scalable, cost-effective solutions for livestock management.
Leave us a comment below if you have any questions regarding this project design. And if you replicated it or even upgraded the features than it already is. Let us know too.
FAQs
How far can the LoRa module communicate? LoRa modules can communicate over distances up to 10 km, depending on the terrain and environmental conditions.
Can this system be adapted for larger herds? Yes, the system can be scaled by adding more transmitters, allowing multiple animals to be tracked simultaneously.
How does the GSM module send location data? The GSM module sends an SMS to the farmer with the livestock’s GPS coordinates in the form of a Google Maps link.
Is the system waterproof? The system components can be housed in waterproof enclosures to protect them from rain or other environmental factors.
What happens if the battery runs out? If the LiPo battery runs out, the system will stop functioning. Incorporating a solar charging system can help maintain continuous power.