Today, we will be debugging our code for errors and misbehaviors. We will start by deliberately injecting with error codes inside the HTML and CSS file and proceed to find the various ways on how to debug the code . In web development, we will always run into bugs and errors in our codes when developing websites or web apps, and this is especially when the website isn’t giving us the look or behavior that we are aiming for.
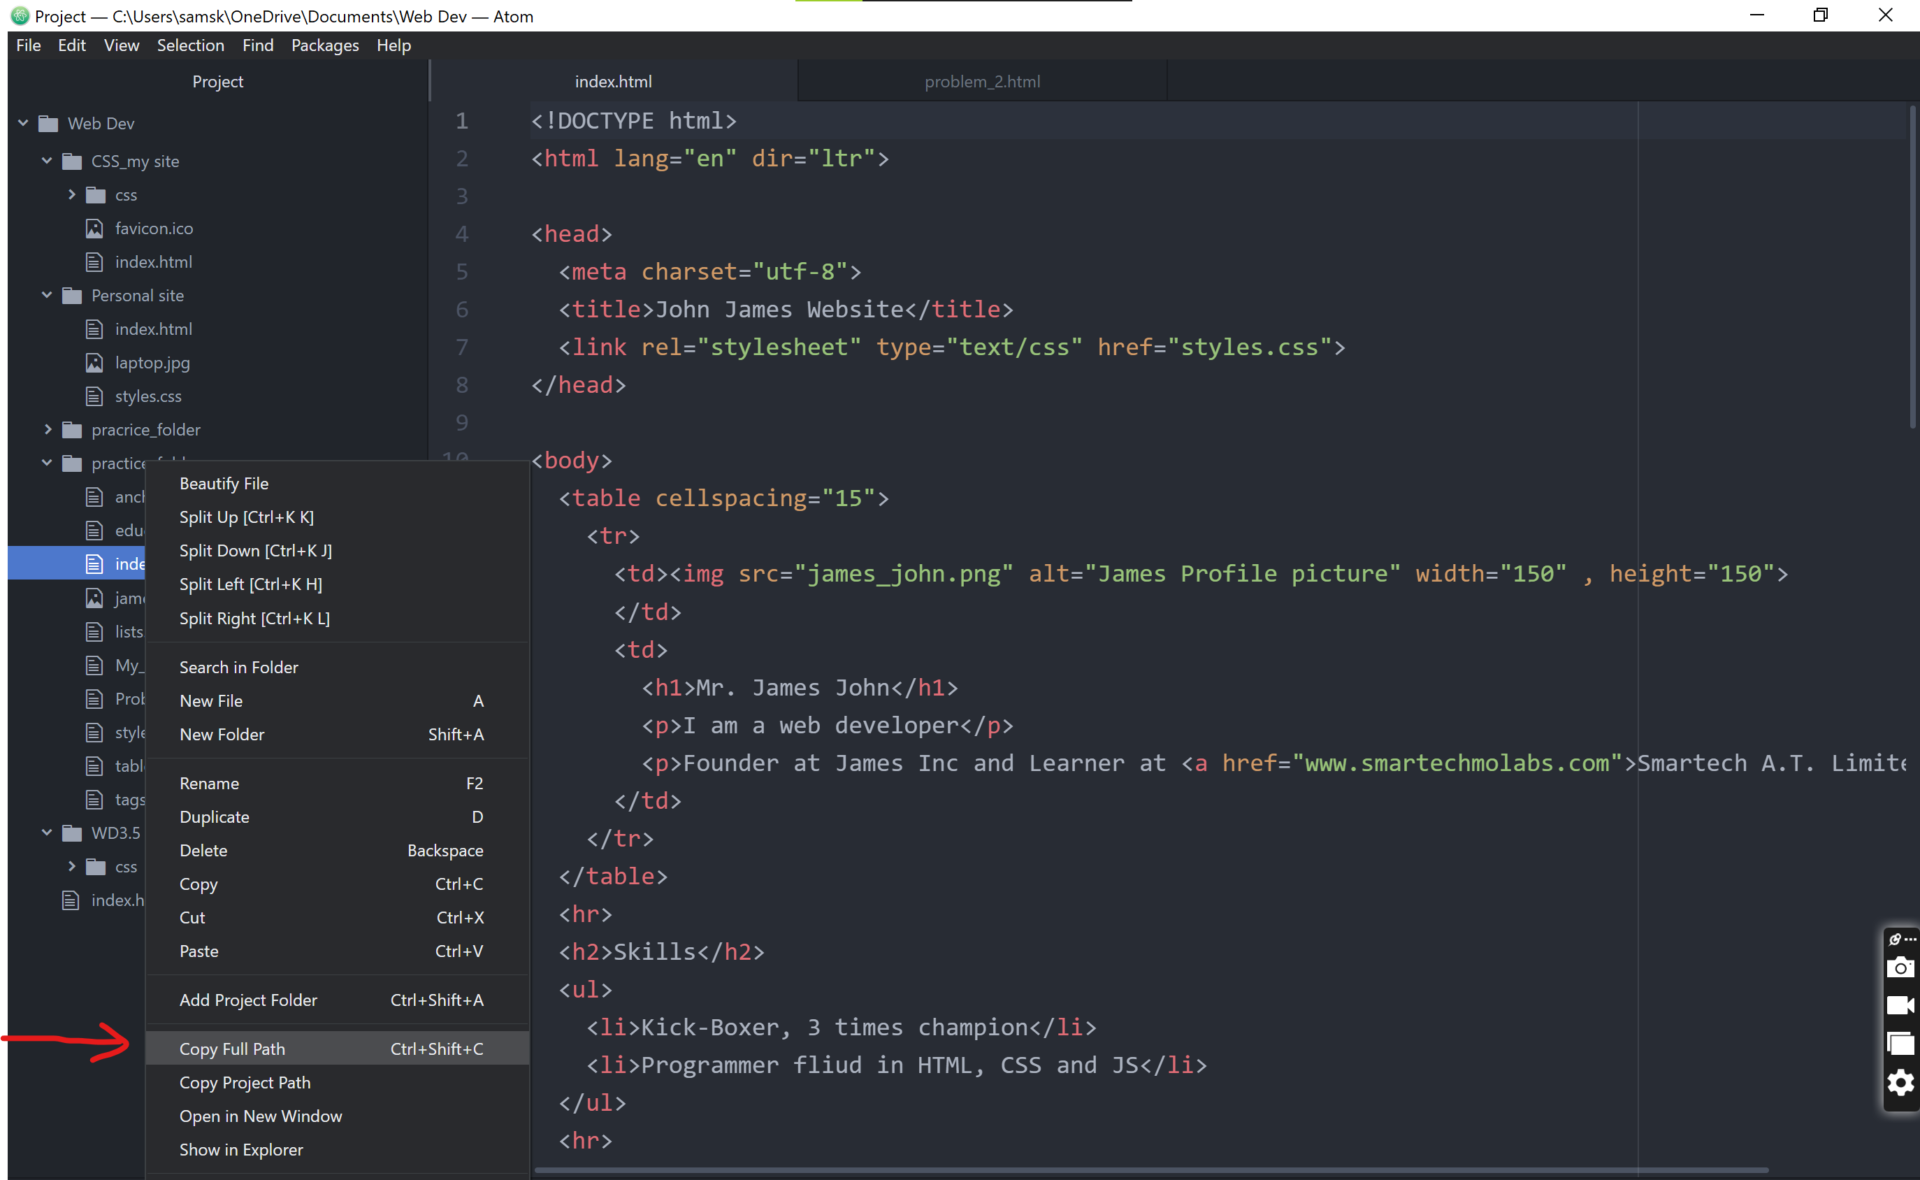
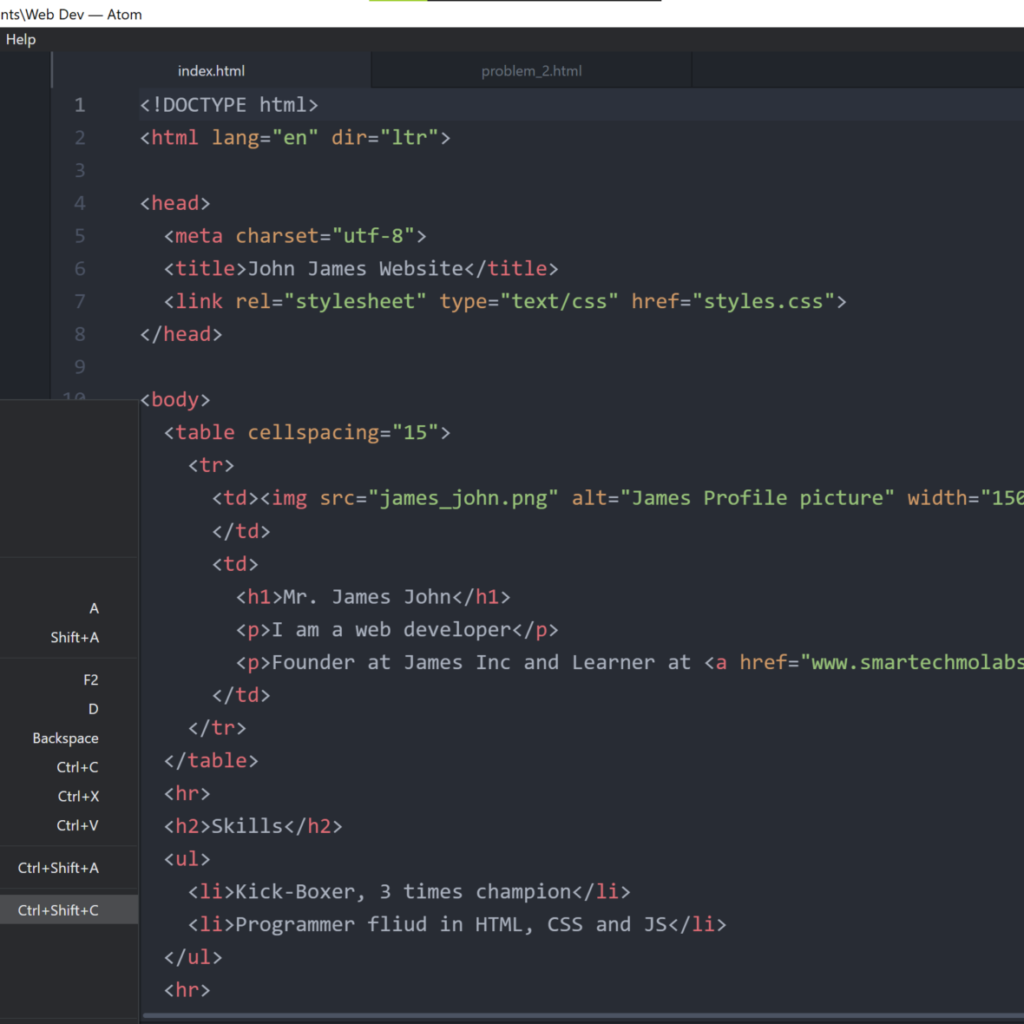
We will be using our previous HTML file for our personal CV website. The first thing to do is to open this file in the Atom Editor, and we proceed to “copy full path” of this file as shown above. This action is like copying the file link in the local directory on your PC.
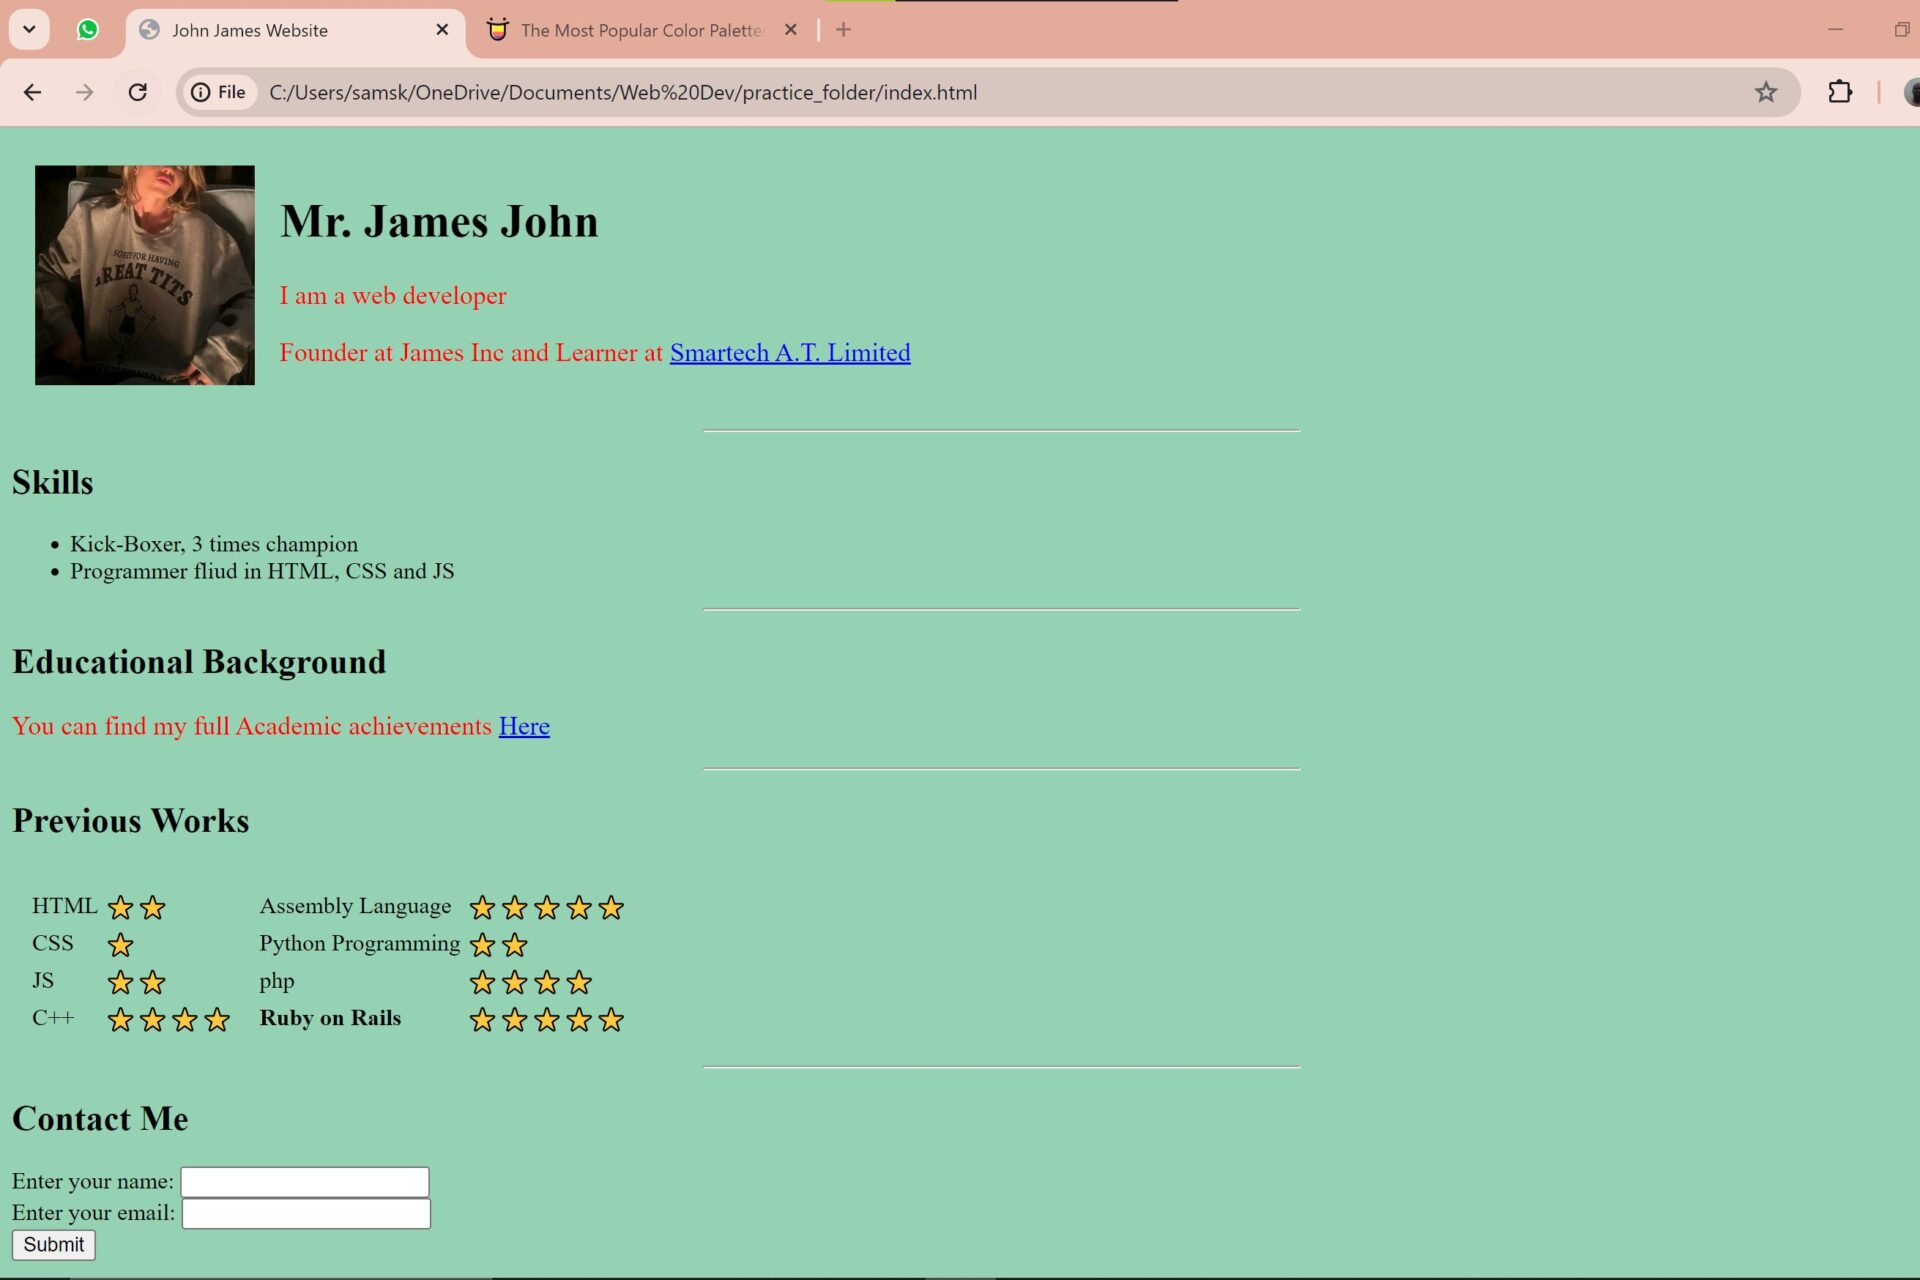
Using Google Chrome browser, we pasted this link in a tab. and we can hit the “Enter” button on the keyboard and watch the page come to live. The website page is shown above and it has this color and feel that makes it subtle. The background color was gotten color hunt website and they have curated a lot of amazing colors for your choice.
How to Debug Your Codes for Errors: Problem 1
Now, let us intentional try and solve the same html file with some bugs in the lines of codes. Click on the link here to download a file called the problem_2 of the from the practice folder that is currently zipped.
Once the download is complete, unzip the file and try to put it in a folder of your web development. Now when you open the problem_2 HTML file. Inside of that the code lines, you can copy full path of the file and also put this in the browser.
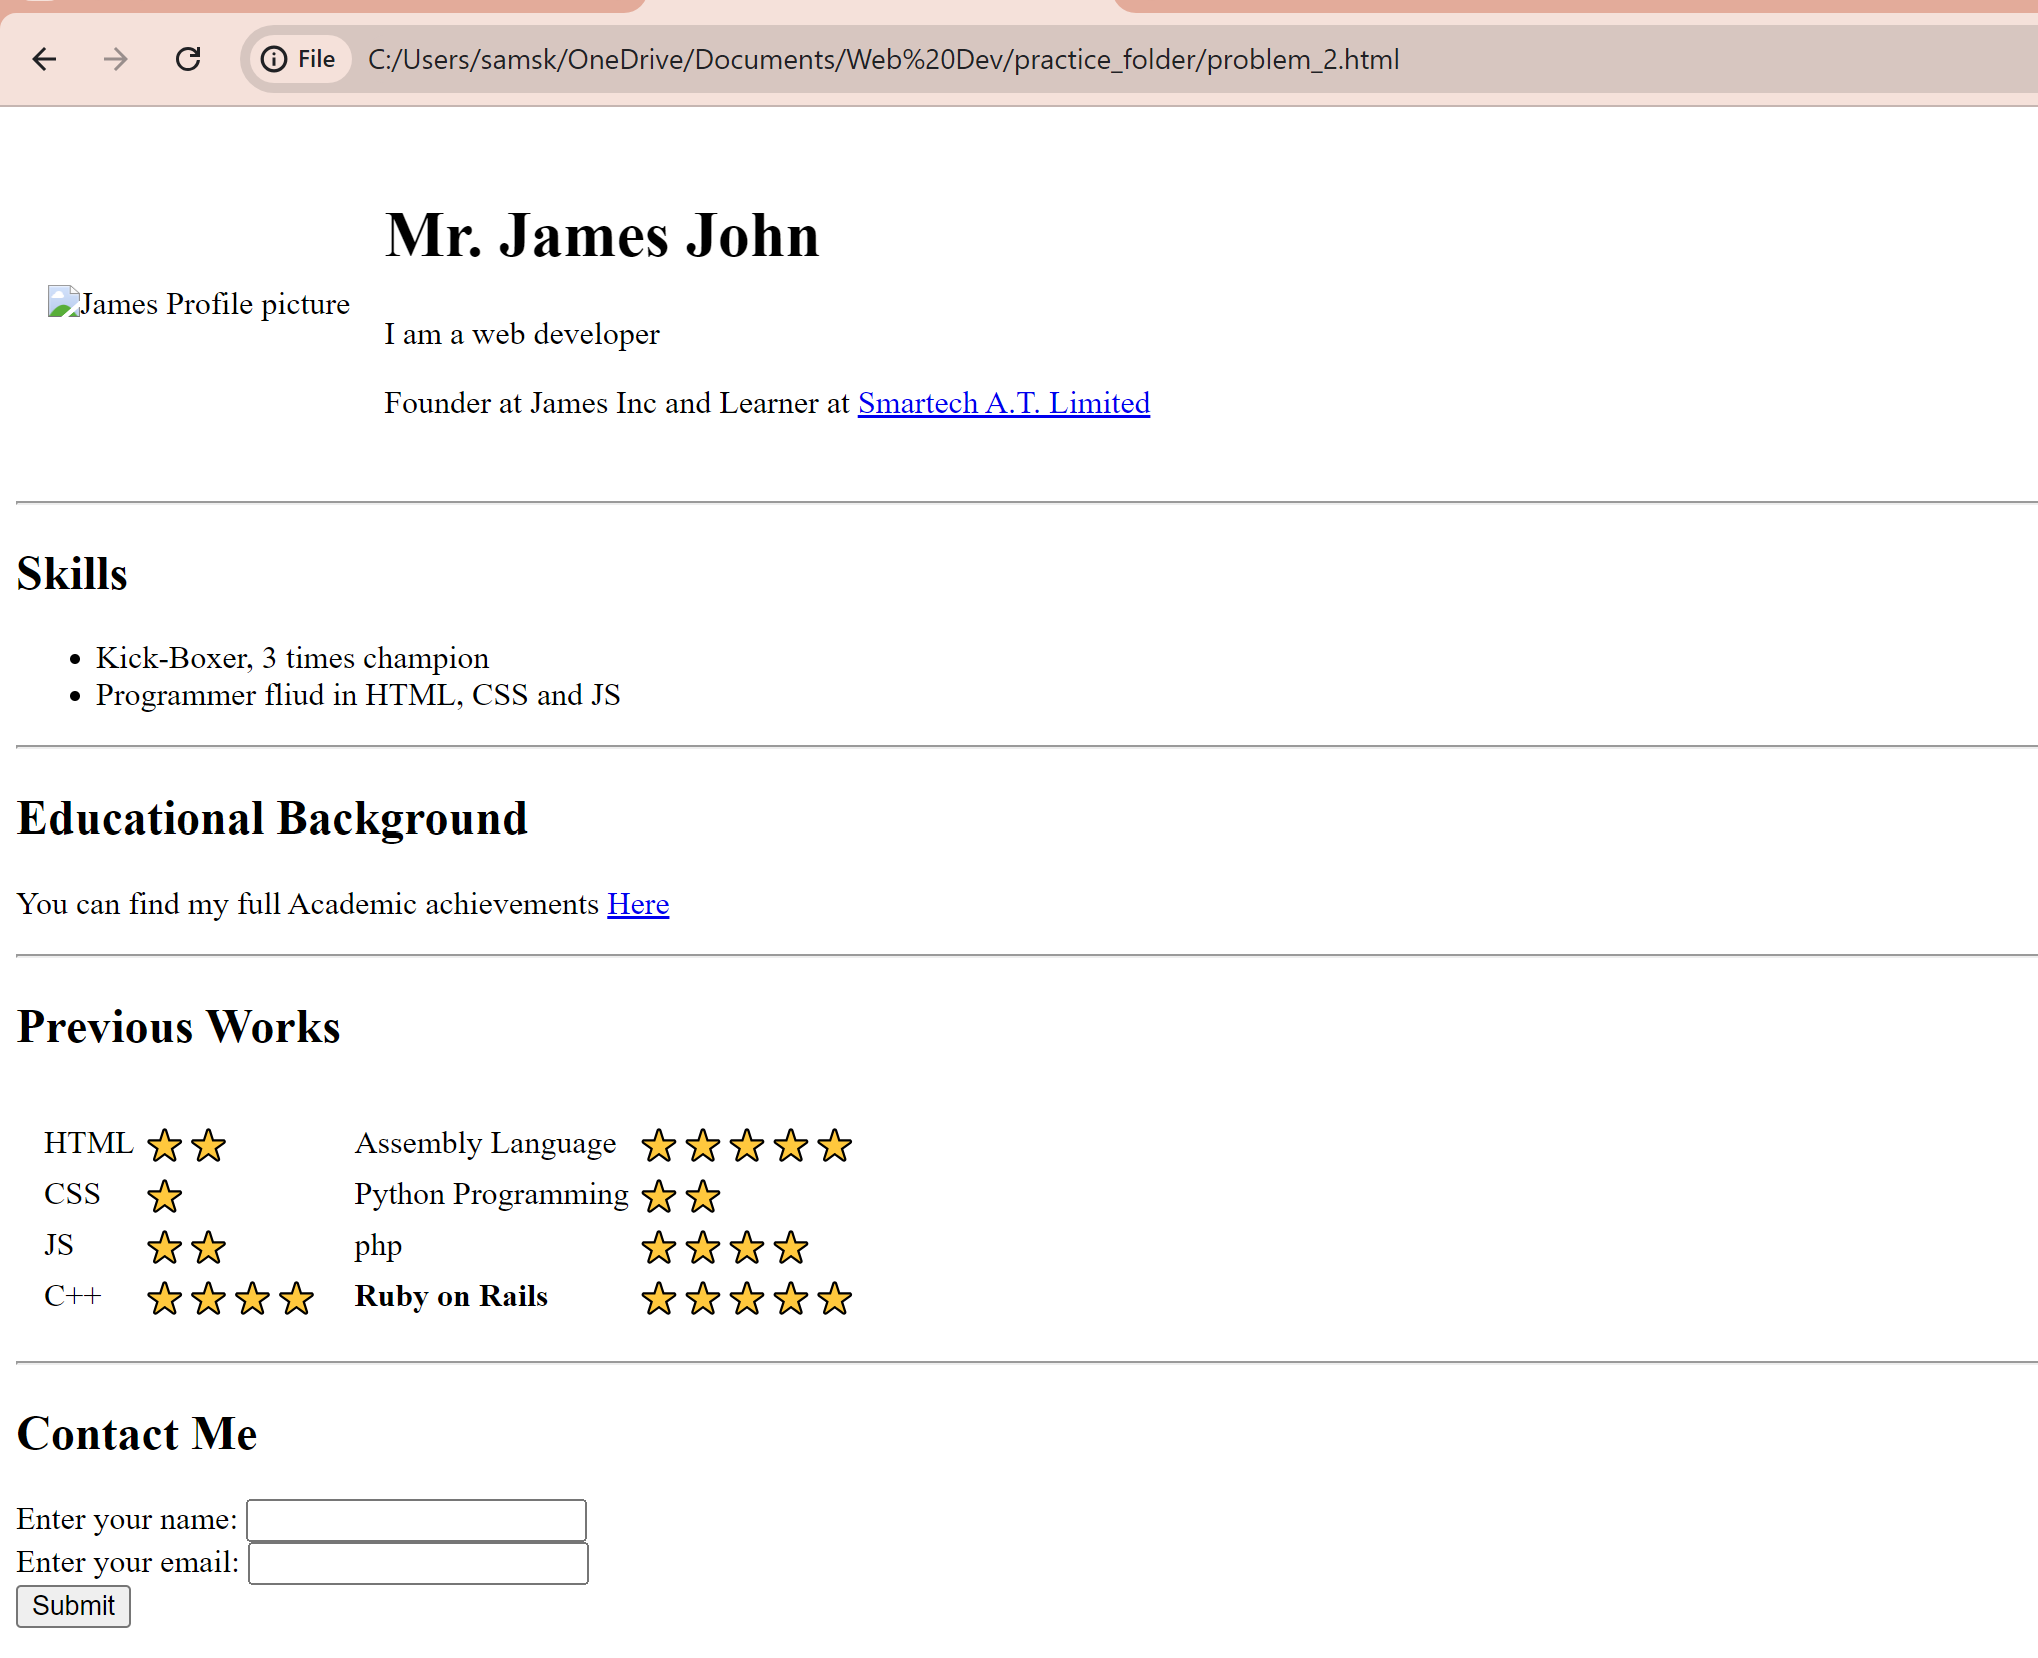
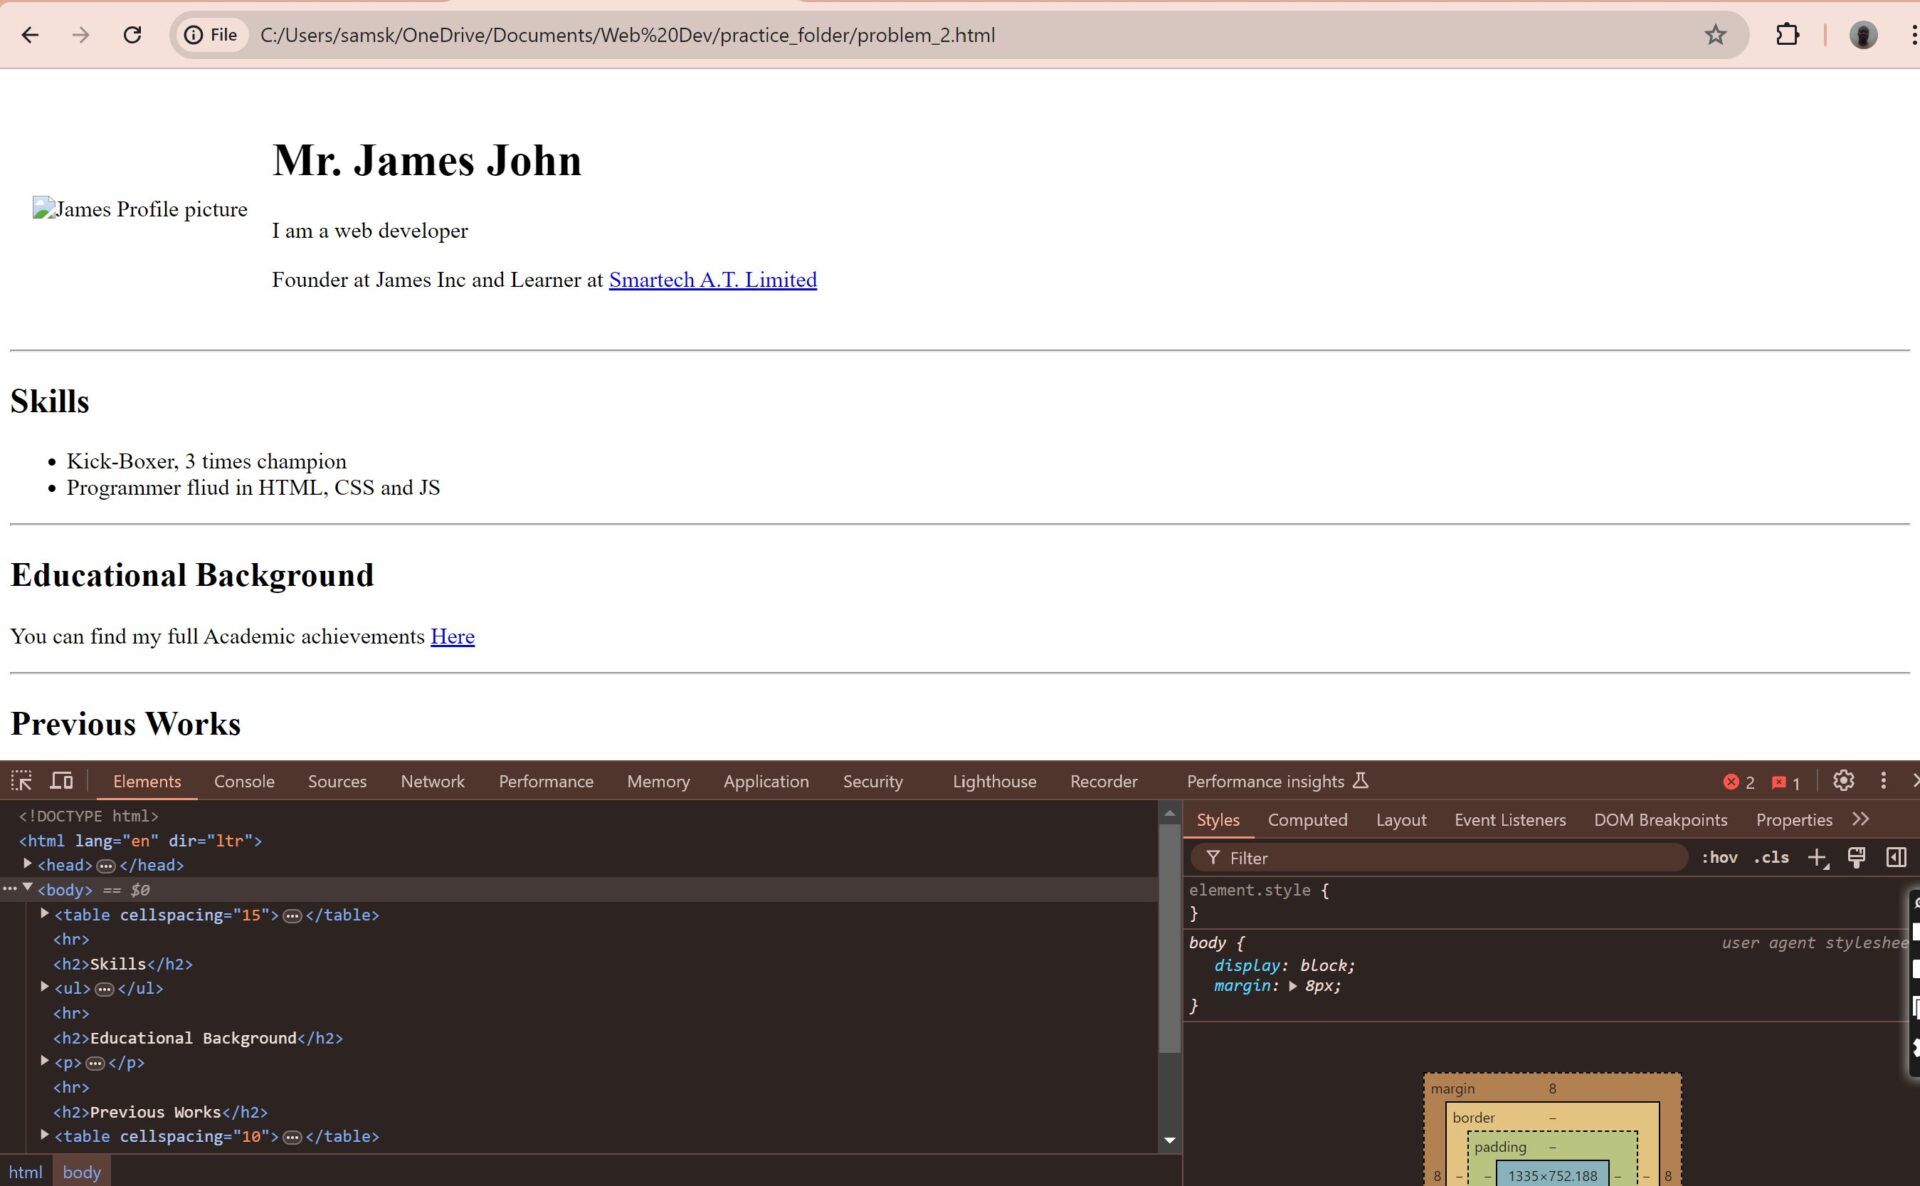
In this problem_2 HTML file as rendered here by the browser, we can see that the CSS properties are missing. The website doesn’t have the background-color and also the image is also missing. To try and see what is going on here; we will use the Google Chrome developer tool in the browser tab.
Read More Posts Like This…
- How to Publish Your HTML Website Free
- Introduction to CSS | Cascading Style Sheets
- Proven Techniques to Train Your Brain for Better Recall
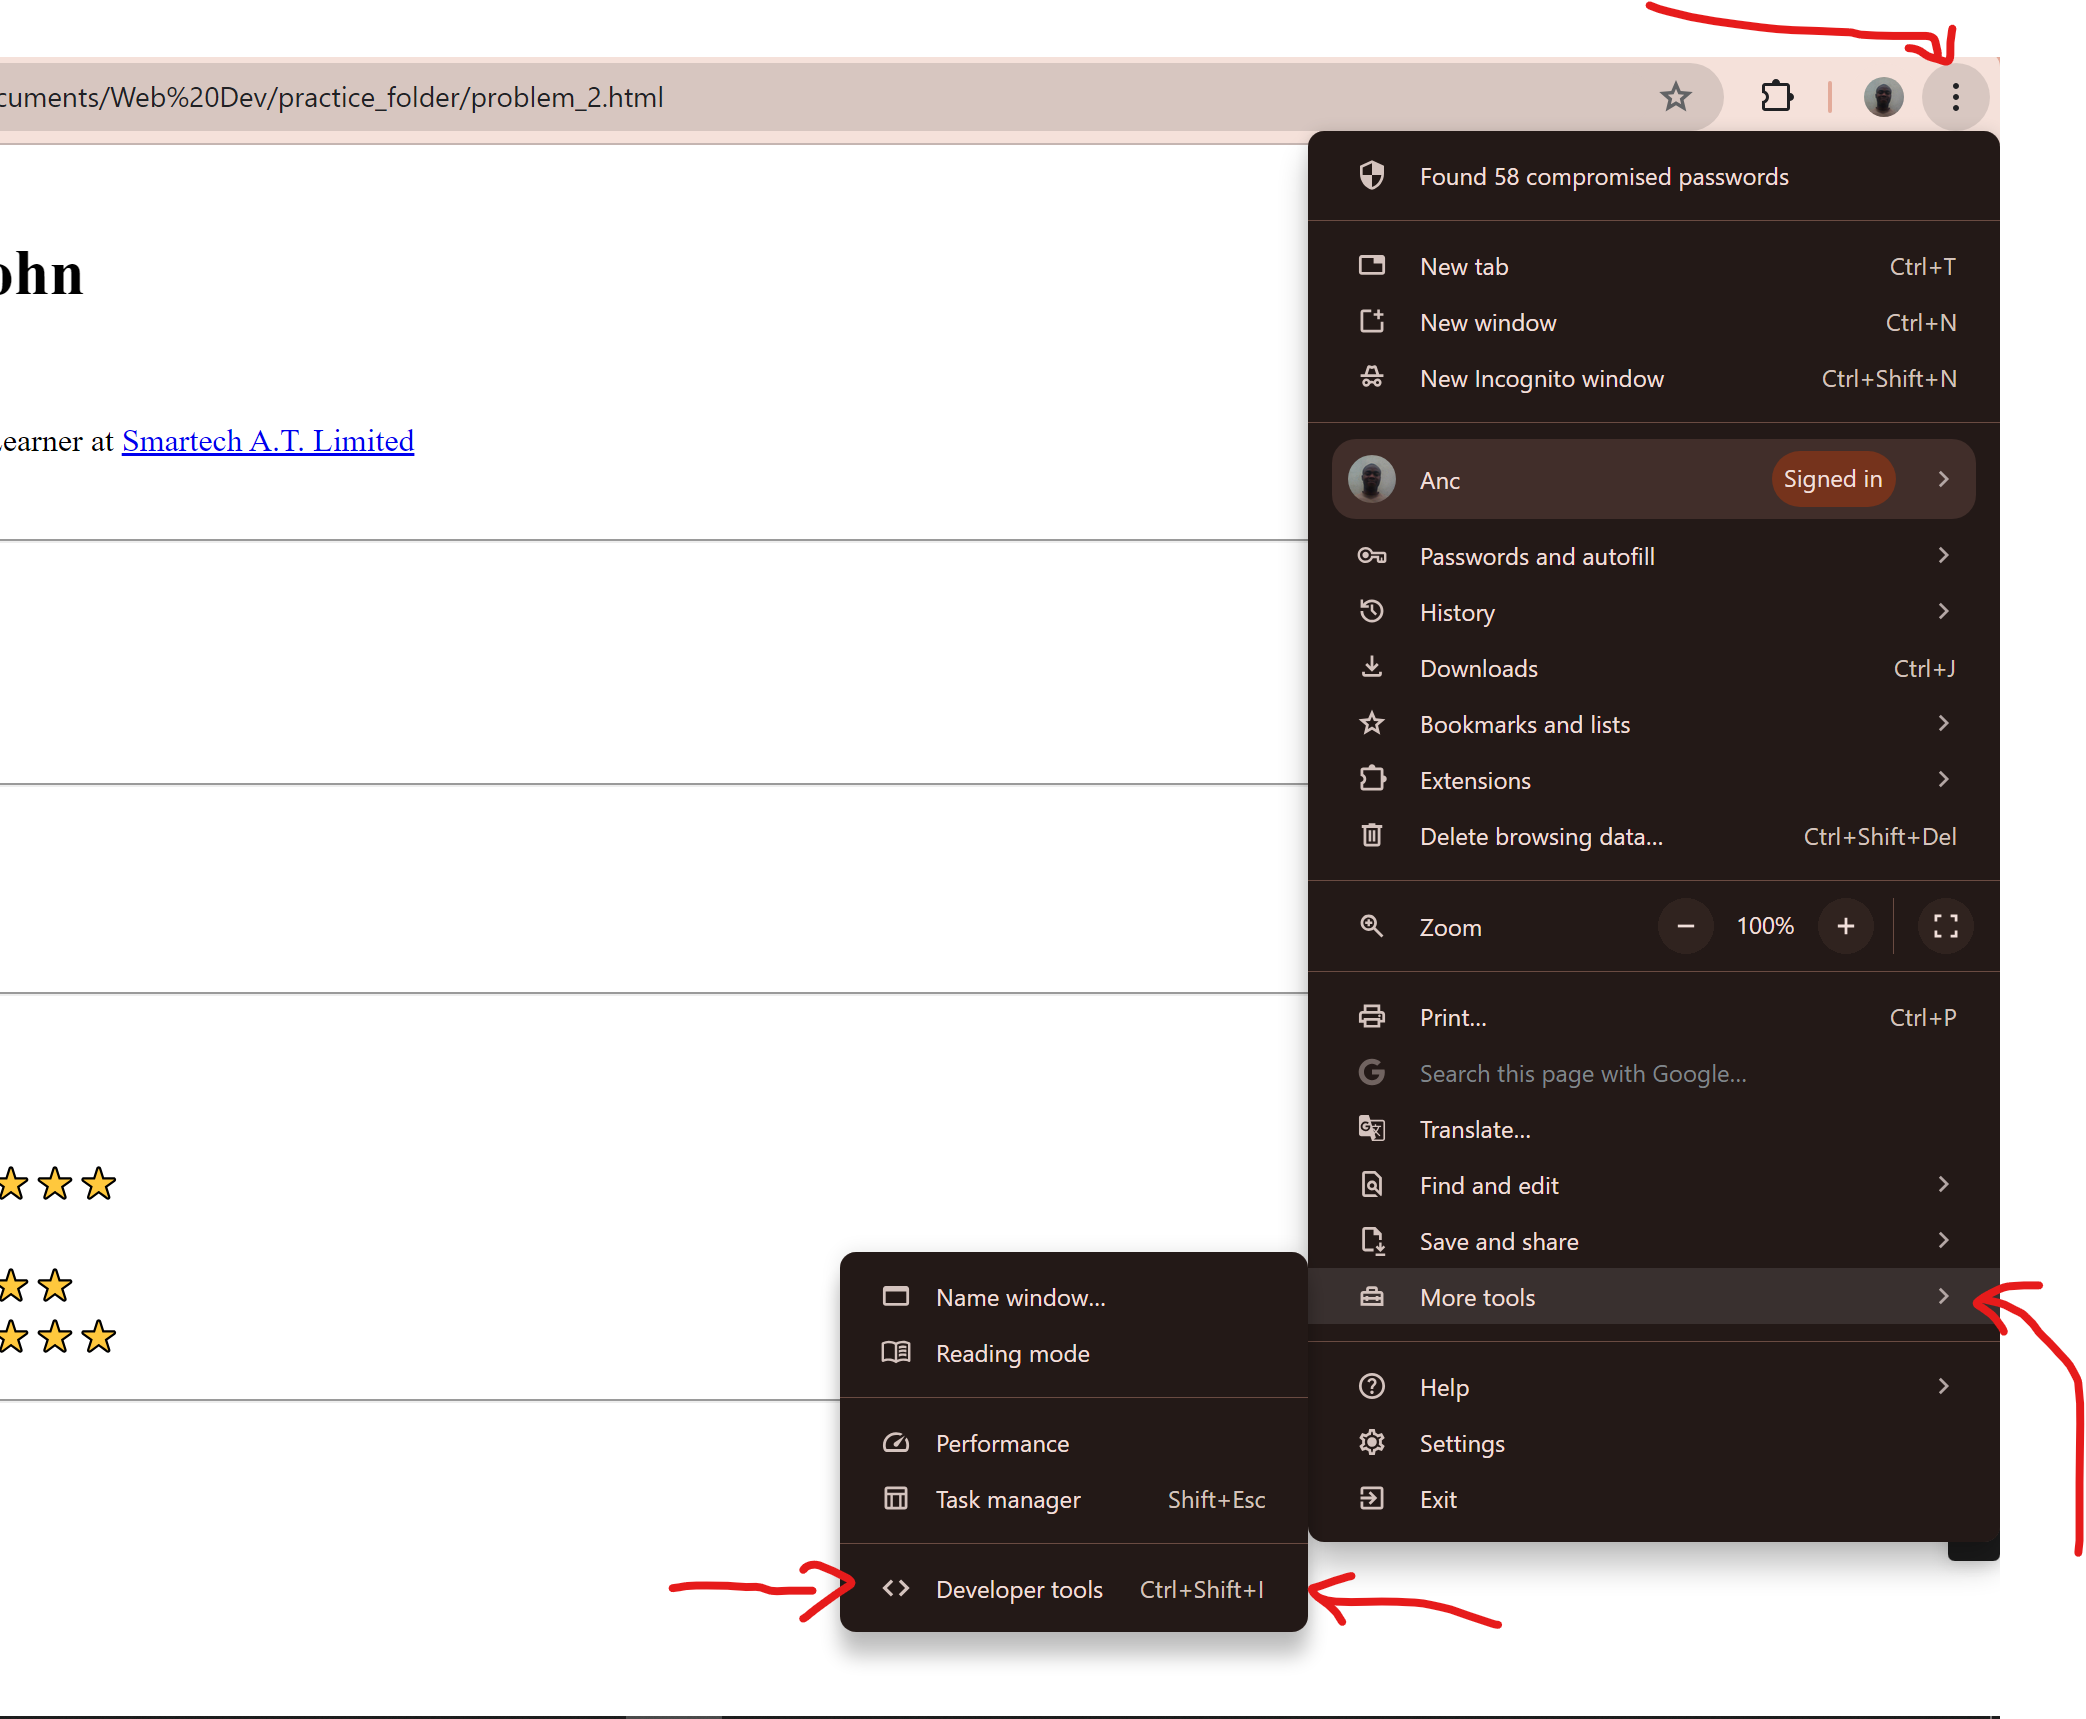
Click on the three dots, then click on the “More Tools” option, and beneath it, you will find the “Developer Tools”. Once we select this, we can see the developer window pop up by the side of the browser as shown below. You can also try and adjust this if you down like where is currently being docked.
There is a 3 dots option too in the current window of the browser you can use this to control where the developer tool is being docked and displayed. Supposing I don’t like the right dock display as shown above, I can click on this 3 dots, and under it I will see the option to change the Dock settings.
Now we can select either for the developer tool to be docked to the left, docked to the right, or docked to the bottom. There is also an option for it to be docked to a separate window.
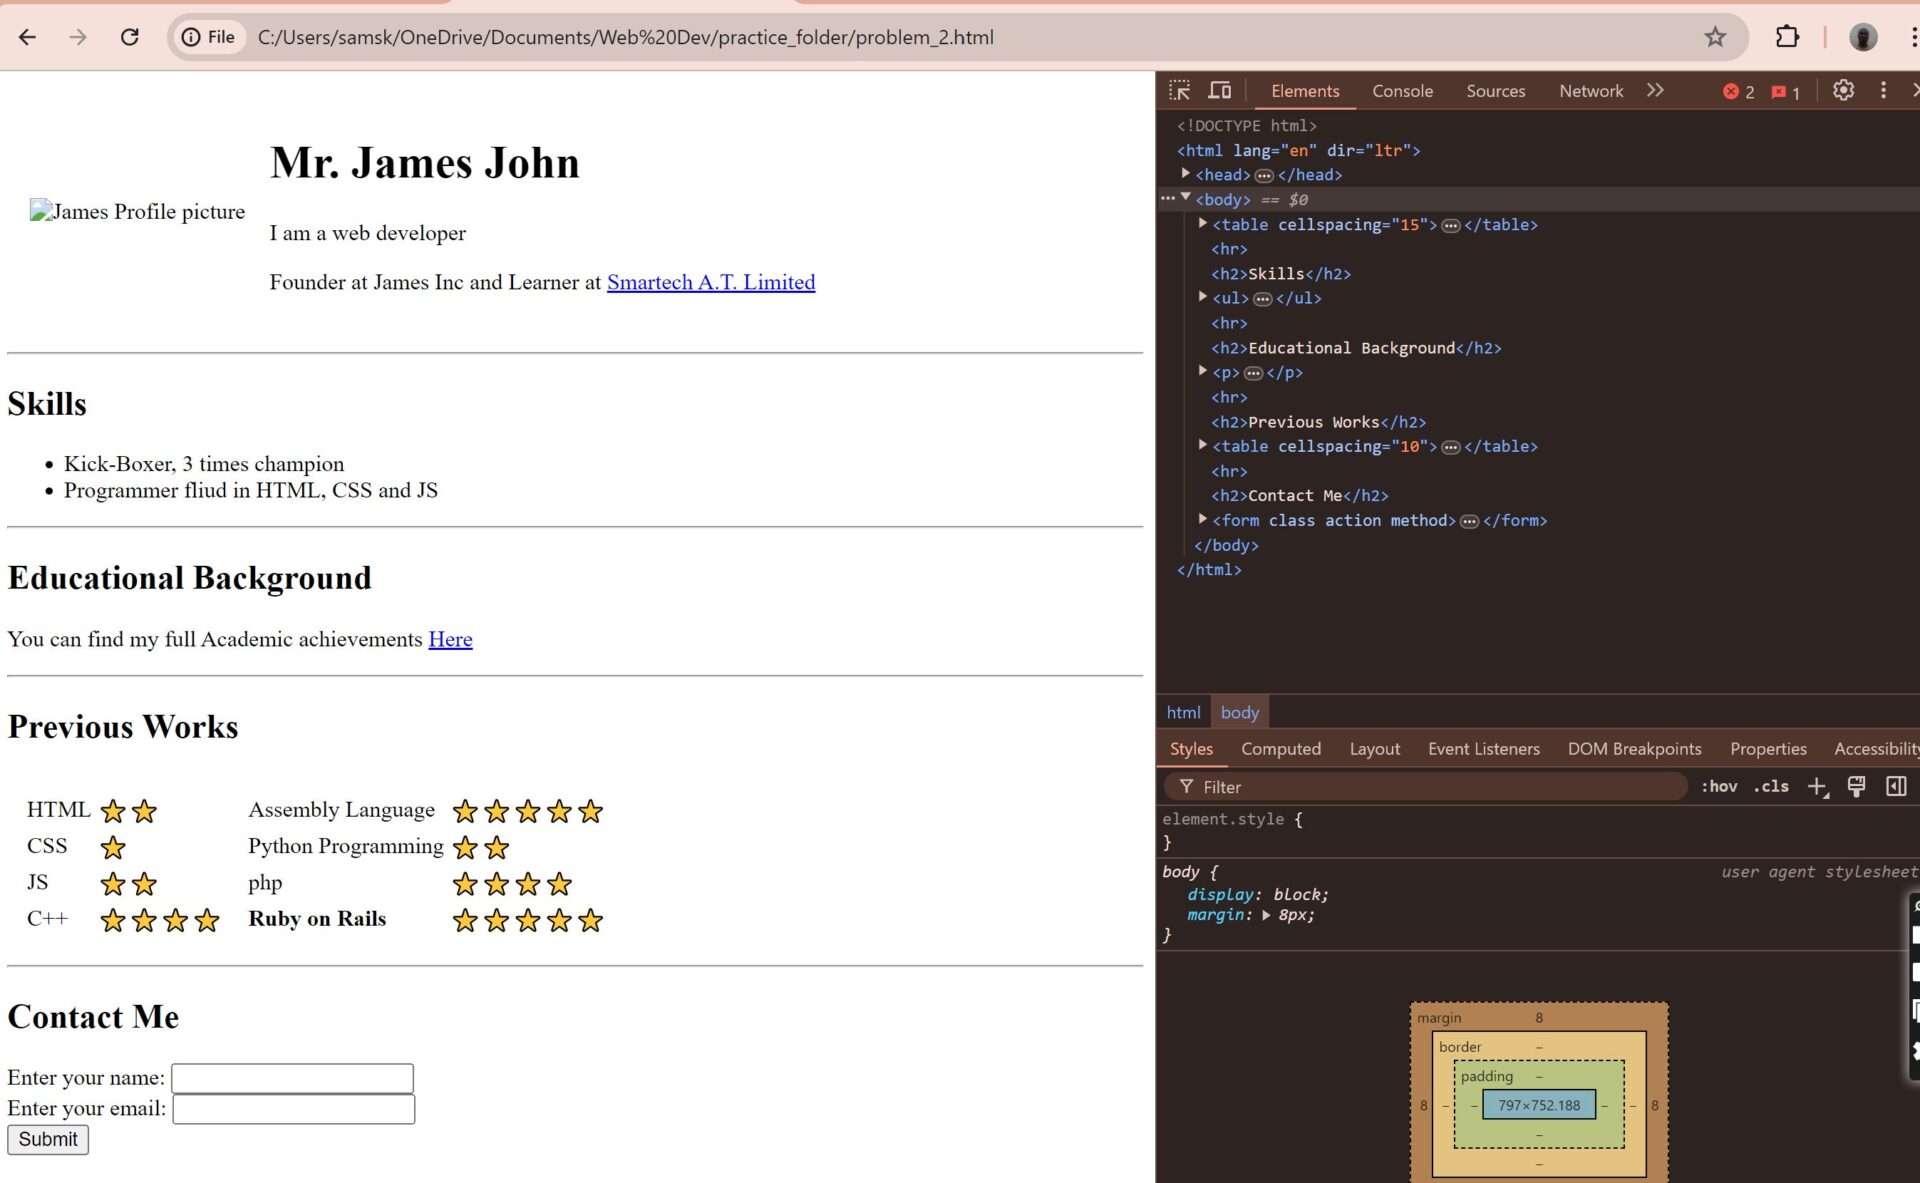
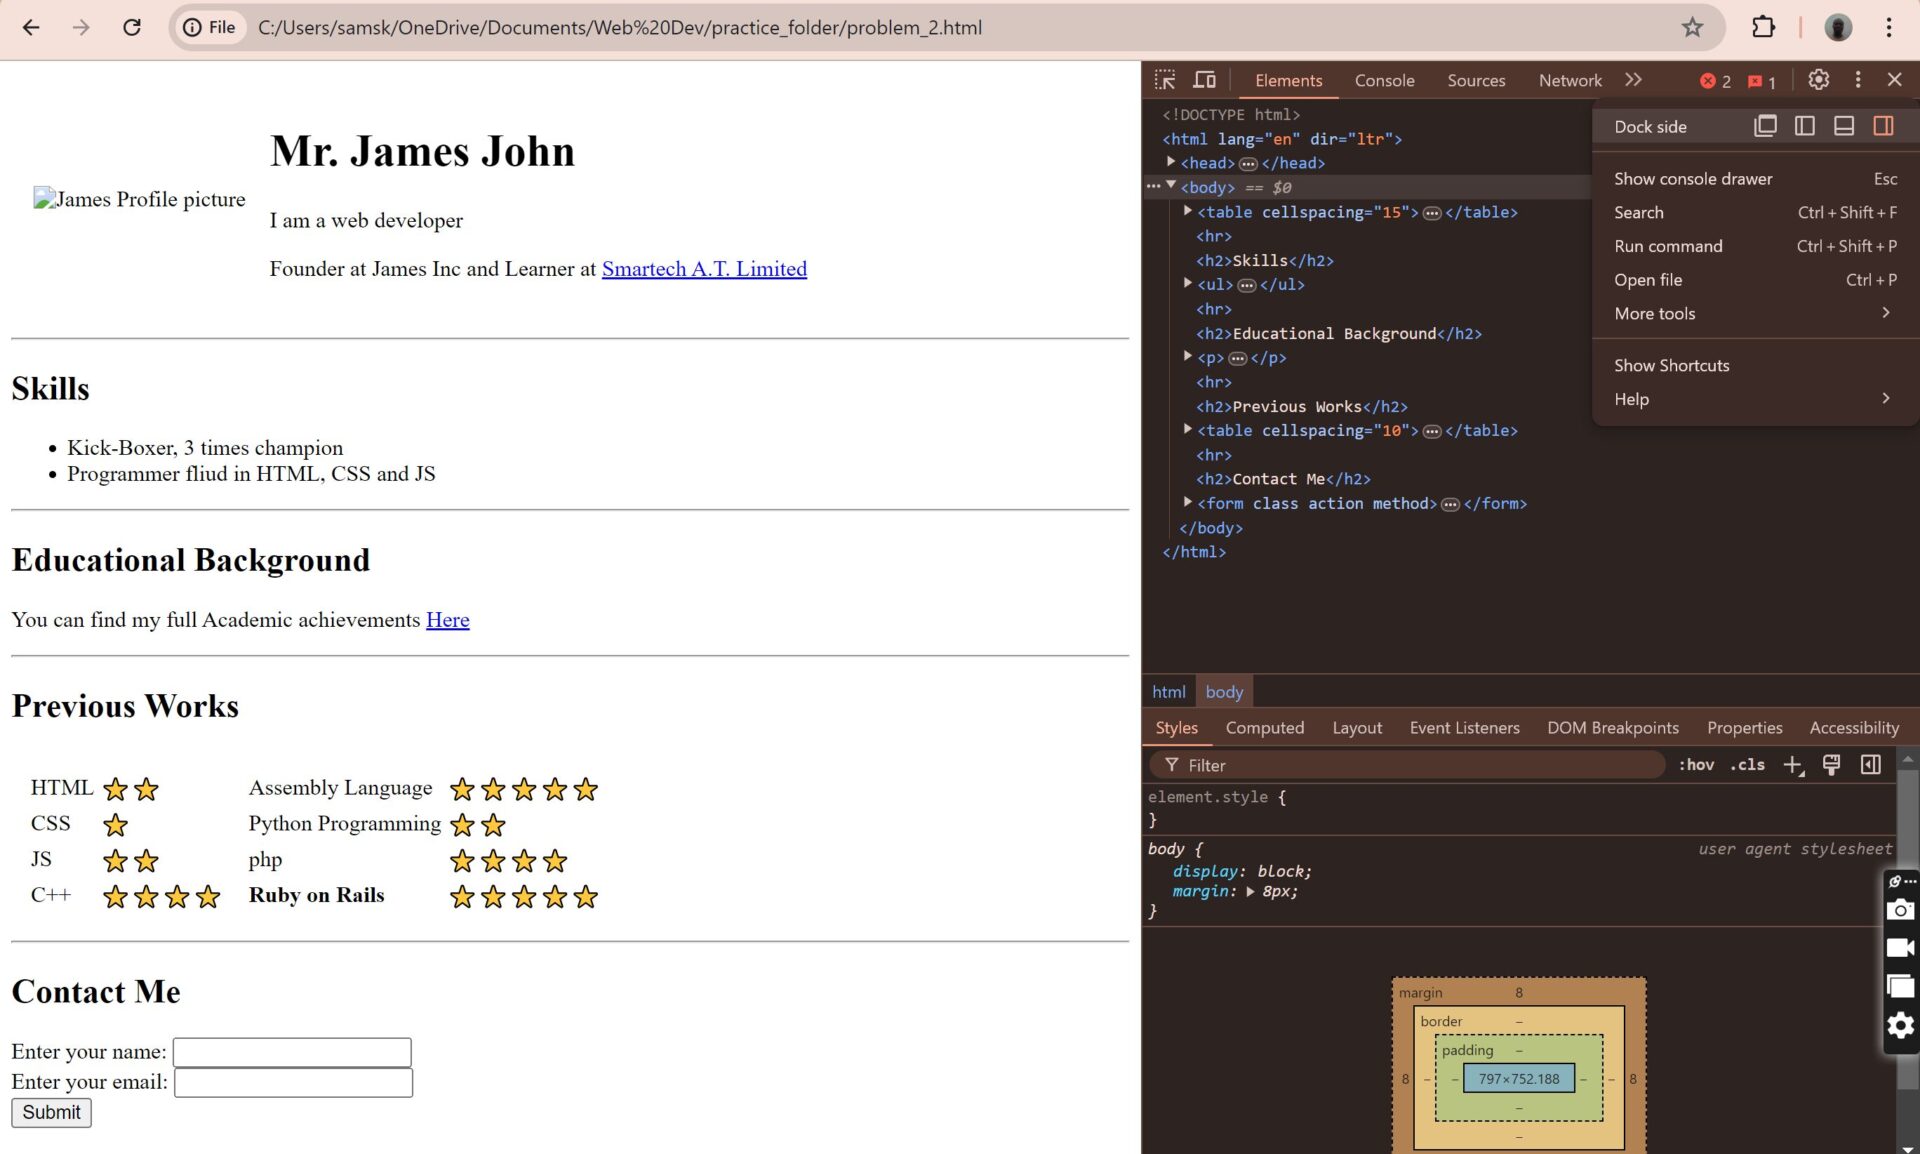
For simplicity, we just used the “dock to the bottom” option as shown in the image above. This would allow us to be looking at the results while figuring out what is wrong with the HTML and CSS lines of code.
We can proceed to selecting the console tab in the developer tools and the moment we do this, it can reveal to us the various resources that are available to it and also the ones that are missing.
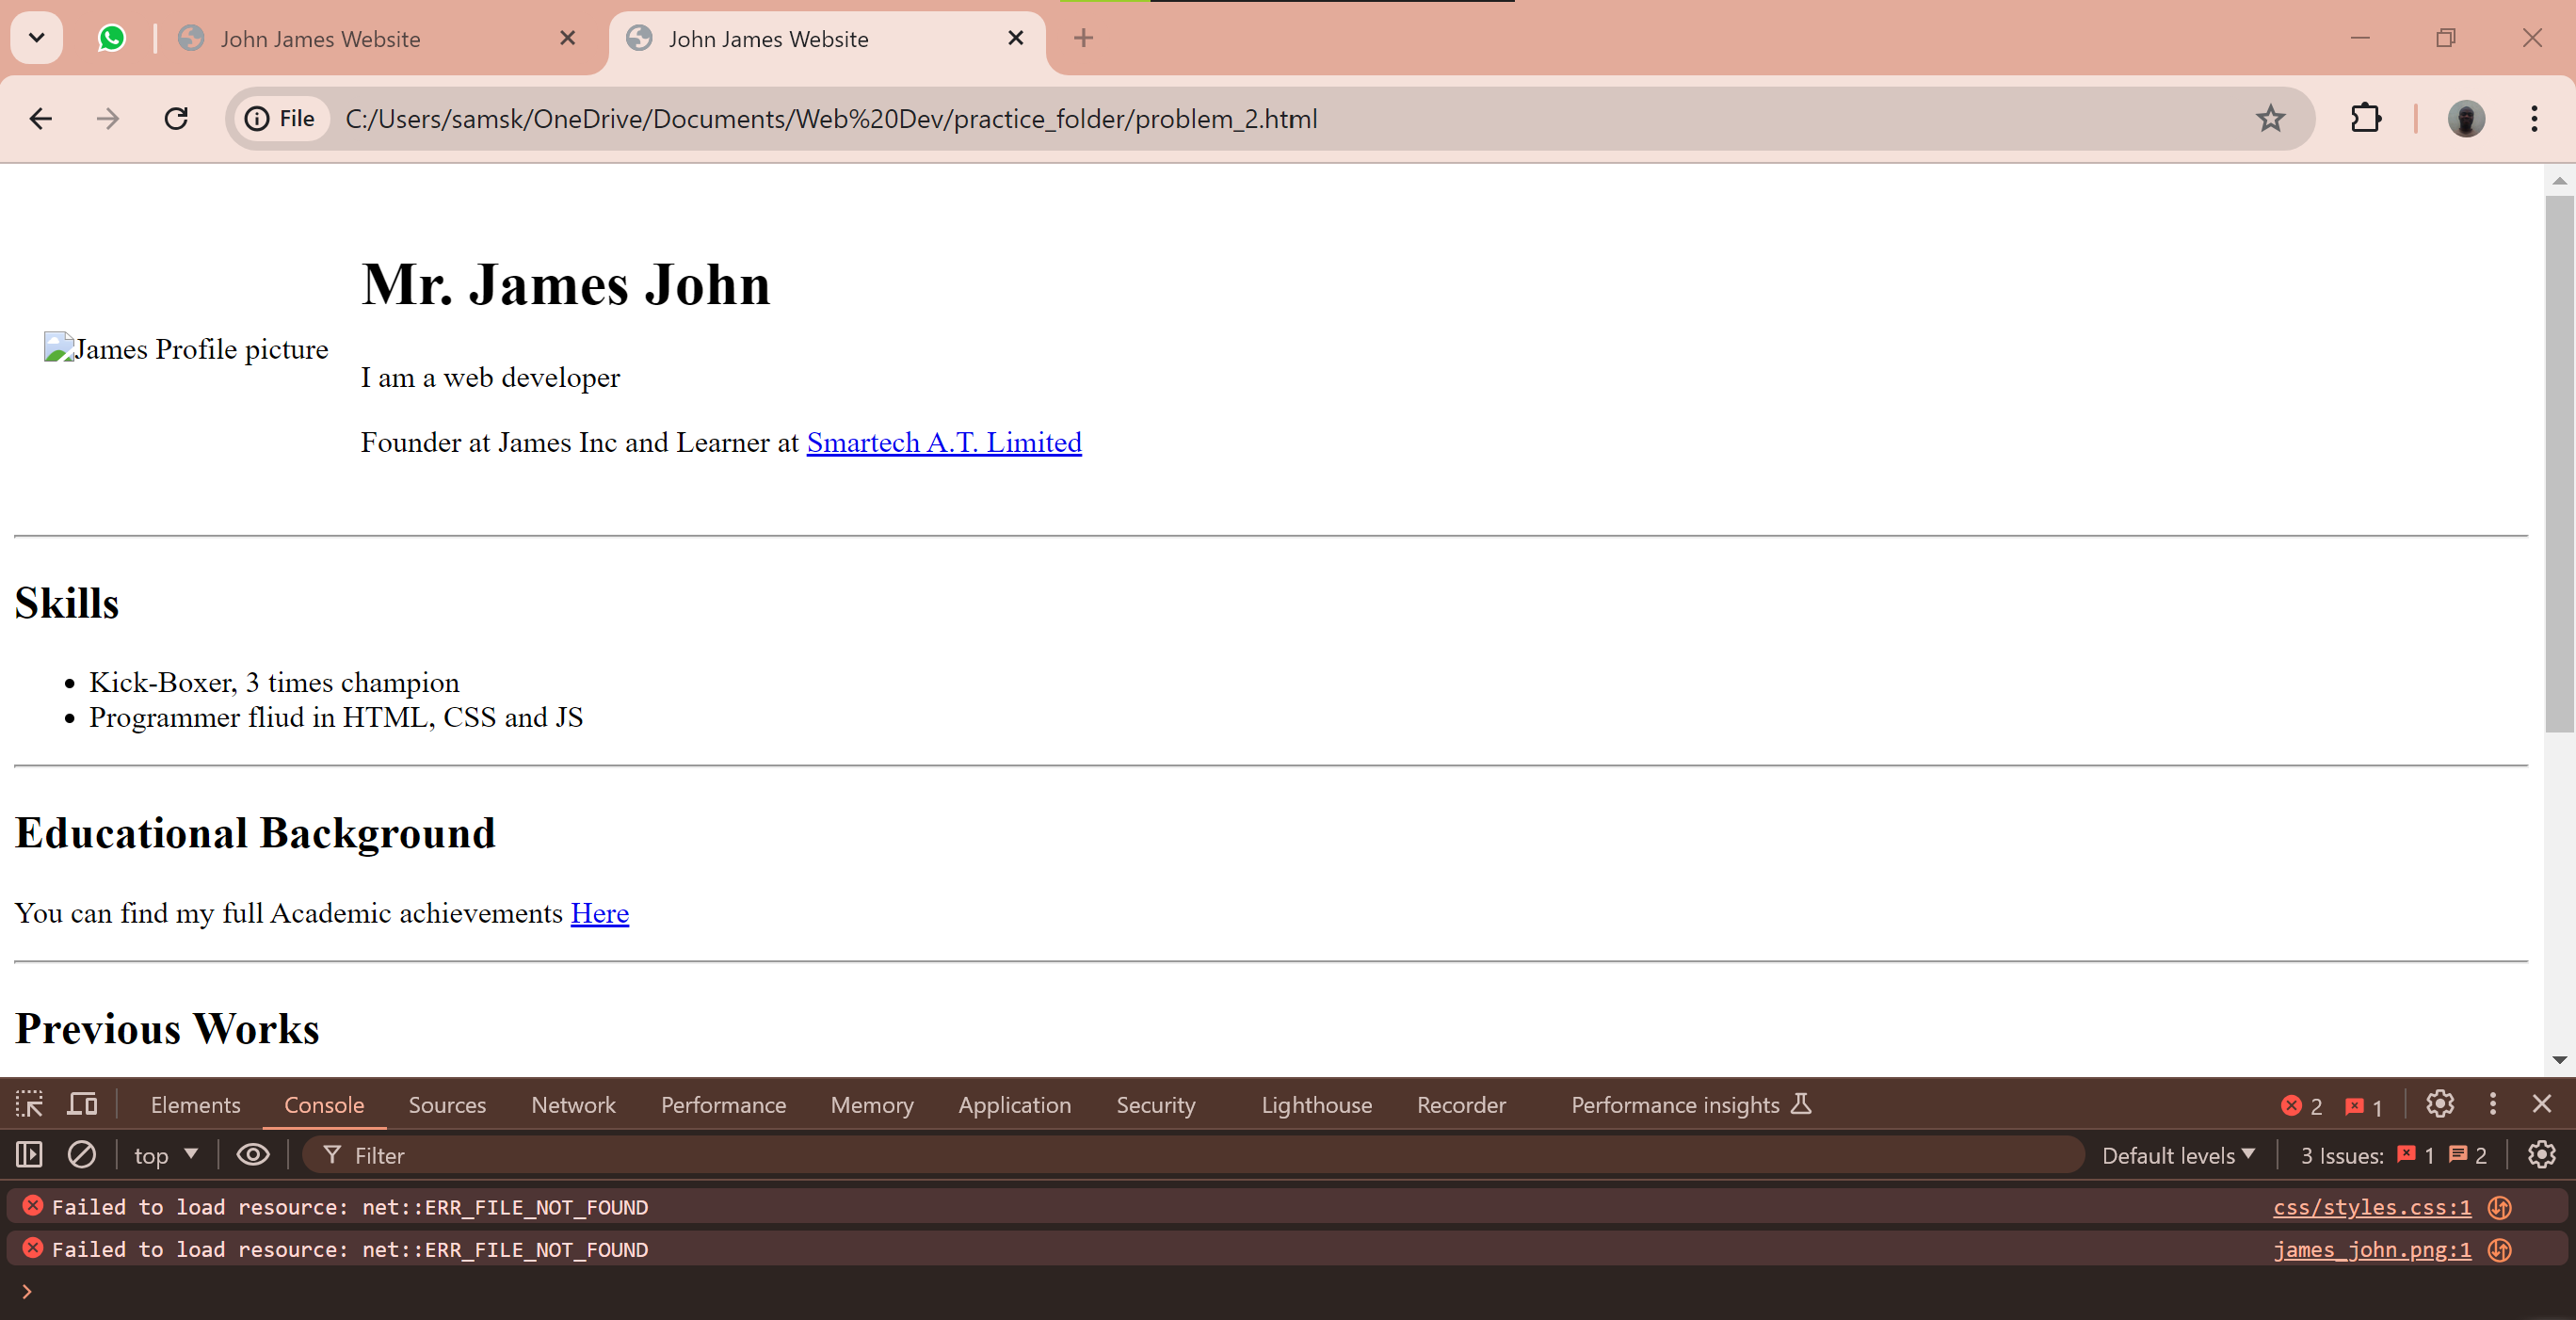
From the screenshot above it is clear that three (3) things or resources are actually missing. Namely; the CSS file that was found in the CSS folder and also the image james_john.png that was supposedly to be found in the images folder.
To fix this, we can either either remove the “images/” before the image name in the HTML code and point the image location as it is, or create an images folder in that folder then move the image into the folder.
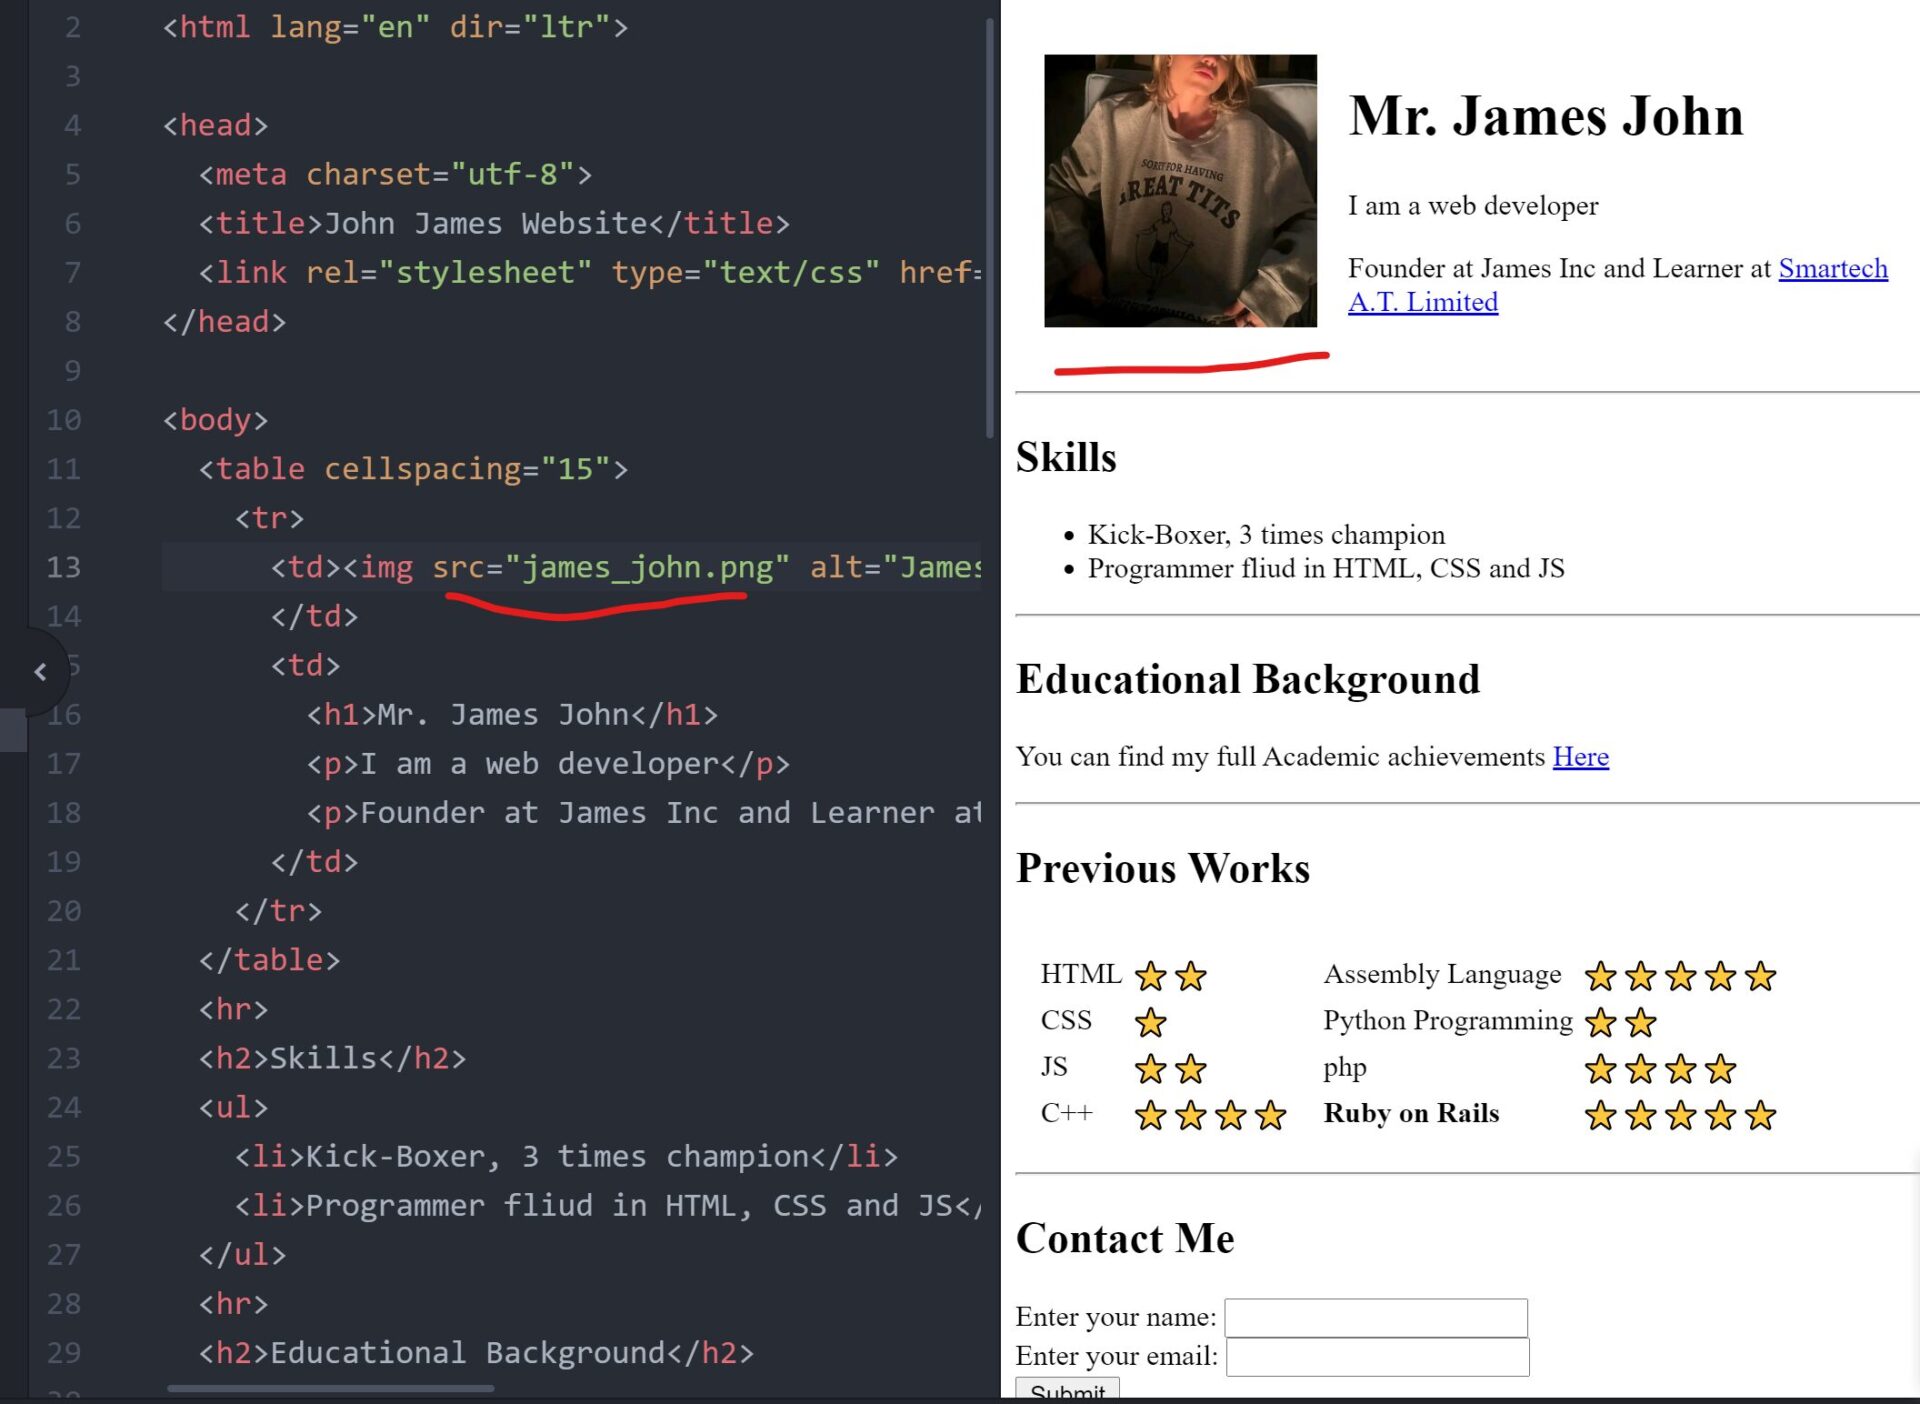
As highlighted above, the image directory link in the href has been fixed now. The link in the href doesn’t goes into a non existent “images” directory any more. This reality is displayed above and it is underscored using red pen.

Alternatively, we can create a new folder (directory) under the Practice Folder, and leave it HTML code just the way it was. This method may seem more effective. Since it doesn’t really change the code itself. For those of us is afraid for breaking their code during development.
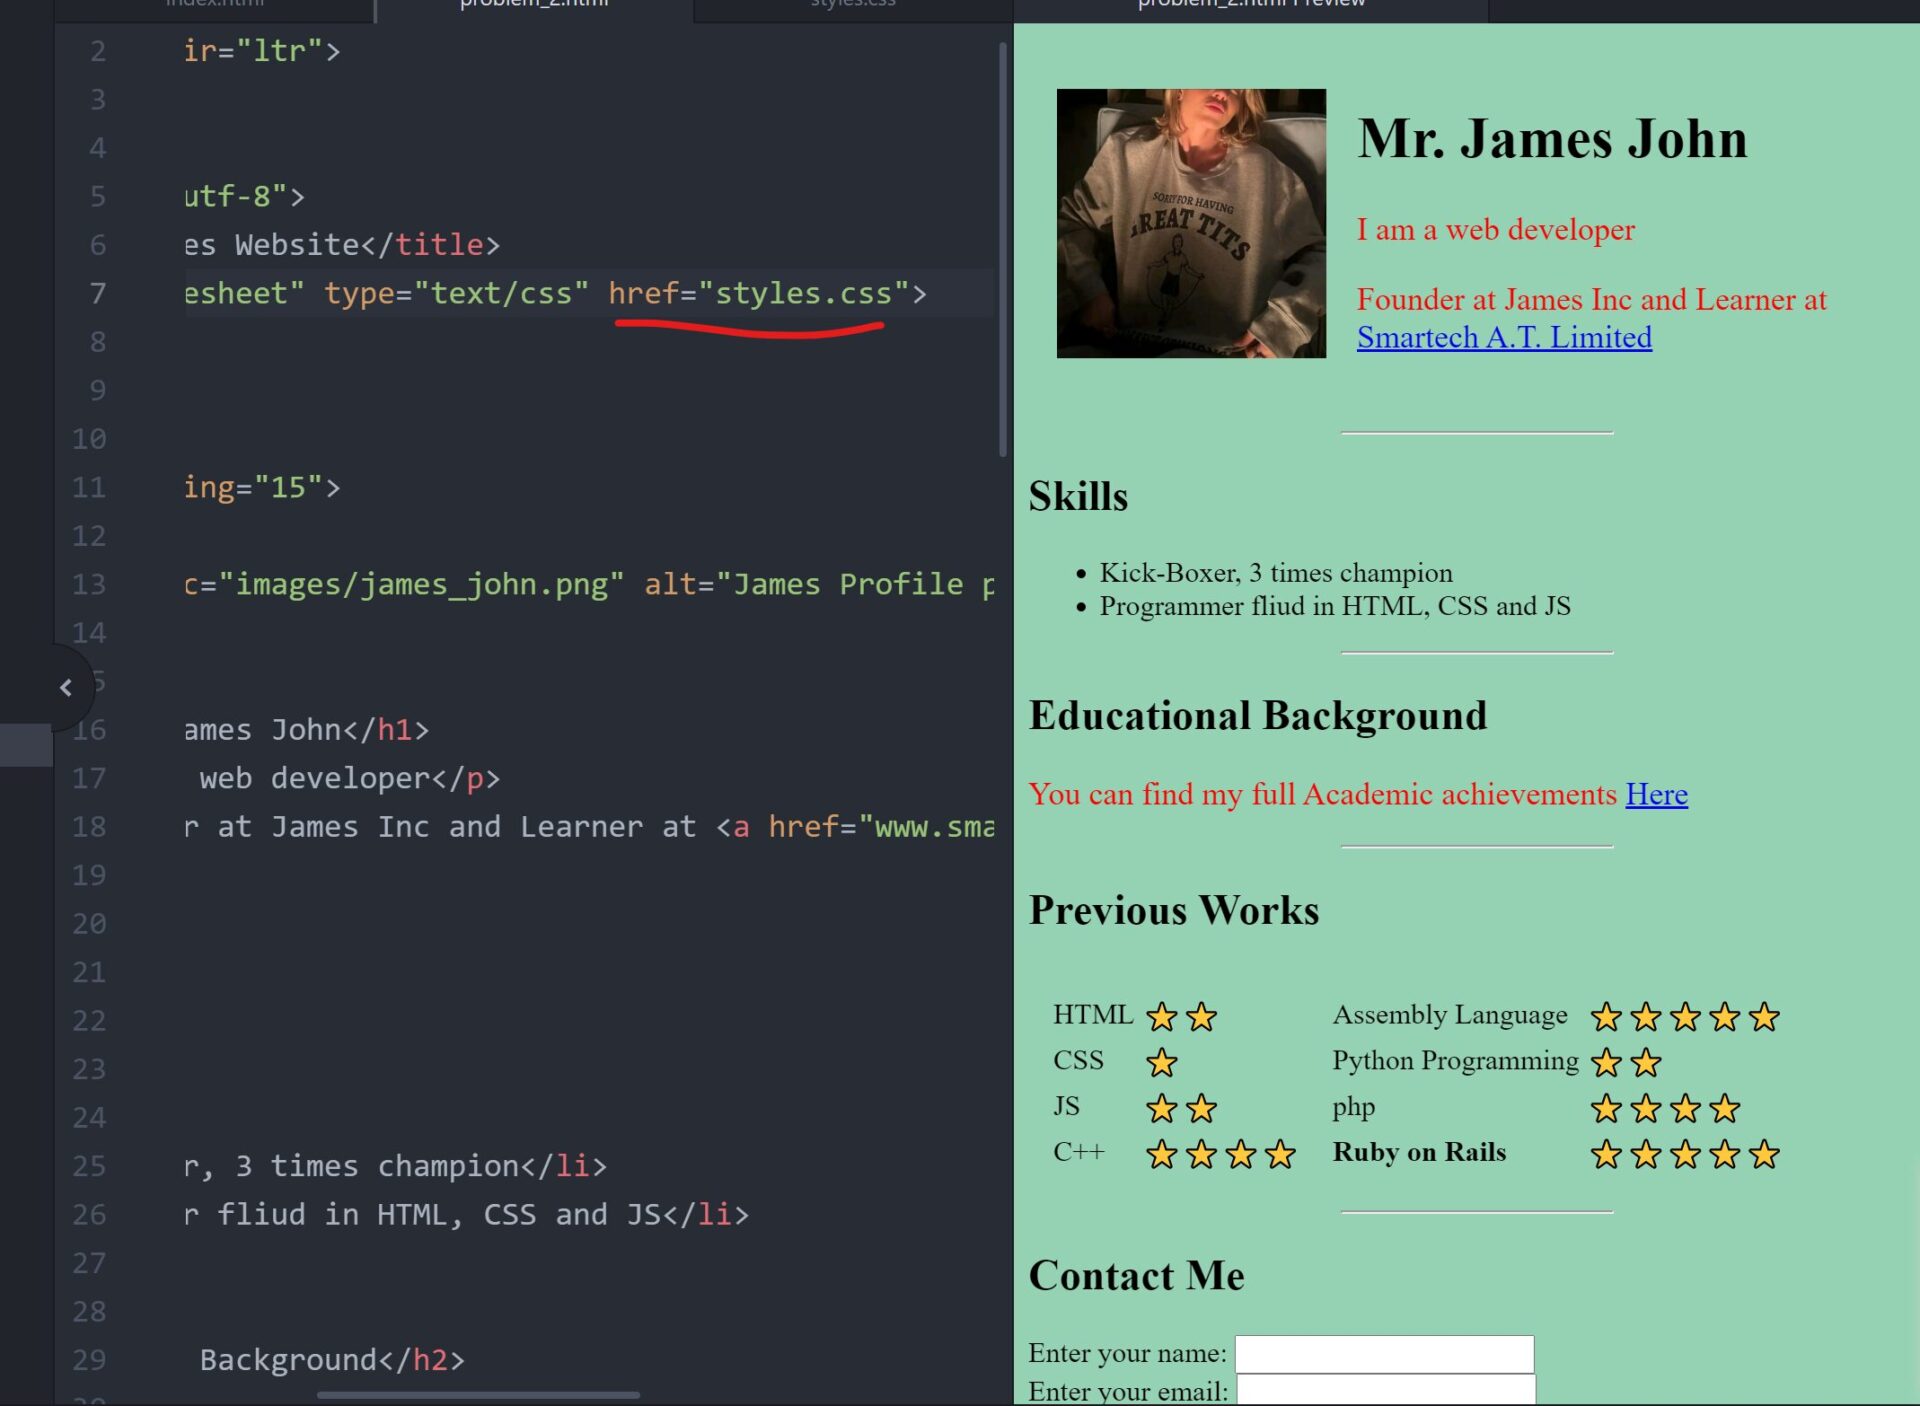
To resolve the CSS properties that are not taking effect in the HTML code rendered on the browser, we looked at also the header section of the HTML codes itself. From there we can see that the href is point to a root folder called CSS. We can either use the code edit method to point the href to the right folder or CSS file or we can create a new folder. I recommend the former since it is the best approach.
Conclusion
We have been able to debug the HTML code to resolve the missing CSS properties and HTML elements in the file itself using the Chrome developer tool. Now, you can try some more practice questions below to get yourself warmed up.
More Practice Questions On How To Debug Codes in HTML and CSS
- Check Out the question on the HTML and CSS code below:
<!DOCTYPE html>
<html lang="en">
<head>
  <meta charset="UTF-8">
  <title>Welcome to My Website!</title>
  <link rel="stylesheet" href="style.css">
</head>
<body>
  <h1>Welcome</h1>
  <p>This is my website. It's still under construction, but I'm excited to share it with you!</p>

  <img src="banner.jpg" alt="Website Banner">
  <h2>Here are some of my interests:</h2>
  <ul>
    <li>Coding</li>
    <li>Photography</li>
    <li>Traveling</li>
  </ul>

  <p>I hope you come back soon!</p>
</body>
</html>
/* Missing curly brace for body styles */
body {
  font-family: Arial, sans-serif;
  font-size: 16px;
  /* Missing semicolon for margin style*/
  margin 20px;
}

h1 {
  color: blue;
  text-align: center;
}

p {
  line-height: 1.5;
}

ul {
  list-style: square;
  padding: 0;
}

li {
  margin-bottom: 10px;
}

/* Image styling with errors */
img {
  width: 100%;
  /* Incorrect property used for border */
  boarder: 5px solid black;
}
There are several errors in this code. Can you identify and fix them?
2. Here is another practice question on HTML and CSS debugging problem
<!DOCTYPE html>
<html lang="en">
<head>
<meta charset="UTF-8">
<title>My Portfolio</title>
<link rel="stylesheet" href="style.css">
</head>
<body>
<header>
<h1>My Portfolio</h1>
<nav>
<a href="#">Home</a>
<a href="#">About Me</a>
<a href="#">Projects</a>
<a href="#">Contact</a>
</nav>
</header>
<main>
<section class="about-me">
<h2>About Me</h2>
<p>I'm a passionate web developer with a love for creating user-friendly and visually appealing websites.</p>
</section>
<section class="projects">
<h2>My Projects</h2>
<img src="project1.jpg" alt="Project 1">
<img src="project2.jpg" alt="Project 2">
<img src="project3.jpg" alt="Project 3">
</section>
</main>
<footer>
<p>© 2024 All Rights Reserved</p>
</footer>
</body>
</html>
body {
  font-family: Arial, sans-serif;
  margin: 0;
}

header {
  background-color: #f1f1f1;
  padding: 20px;
}

nav {
  text-align: center;
}

nav a {
  /* Missing closing curly brace for anchor styles*/
  color: blue;
  text-decoration: none;
  padding: 10px;
  margin: 0 10px;
}

main {
  /* Incorrect property used for background color */
  background-image: lightgray;
}

section {
  padding: 20px;
  /* Missing closing curly brace for section styles*/
  border: 1px solid #ddd;
}

footer {
  text-align: center;
  padding: 10px;
  background-color: #333;
  color: white;
}
This code has a few errors that affect the layout and styling. See if you can identify and fix them.
3. Now try this one that has a “Contact Me” form. Let me know if you need any help.
<!DOCTYPE html>
<html lang="en">
<head>
  <meta charset="UTF-8">
  <title>Contact Me</title>
  <link rel="stylesheet" href="style.css">
</head>
<body>
  <h1>Contact Me</h1>
  <form id="contact-form">
    <label for="name">Name:</label>
    <input type="text" id="name" name="name" placeholder="Your Name">

    <label for="email">Email:</label>
    <input type="email" id="email" name="email" placeholder="Your Email">

    <label for="message">Message:</label>
    <textarea id="message" name="message" rows="5" placeholder="Write your message here"></textarea>

    <button type="submit">Send Message</button>
  </form>
</body>
</html>
body {
  font-family: Arial, sans-serif;
  padding: 20px;
}

h1 {
  text-align: center;
}

form {
  /* Missing value for the margin property */
  margin: ;
  width: 50%;
  margin: 0 auto;
}

label {
  display: block;
  margin-bottom: 5px;
}

input[type="text"],
input[type="email"],
textarea {
  width: 100%;
  padding:
Frequently Asked Questions on How to Debug Codes in HTML and CSS
General Debugging:
- What are some signs that my HTML or CSS code might have errors?
Common signs of errors include:
- The webpage not displaying as expected (styles not applied, elements misplaced, etc.)
- Broken images or missing content
- Error messages in your browser’s developer console
- What tools can I use to debug HTML and CSS?
Your browser’s developer console is your best friend for debugging. It allows you to inspect the HTML structure, see applied CSS styles, and identify errors in your code.
- How do I approach debugging errors?
A common approach is to:
- Identify the issue you’re facing on the webpage.
- Open the developer console and inspect the affected element(s).
- Look for errors or warnings in the console that might point to the problem.
- Make small changes to your code, test the changes in the browser, and see if it fixes the issue.
Specific Debugging Issues:
- I made changes to my CSS code, but they’re not reflected on the webpage. Why?
This might be caused by browser caching. Try clearing your browser cache or doing a hard refresh (Ctrl+Shift+R) to ensure you’re seeing the latest version of your code.
- My styles aren’t being applied to an element, even though the selector seems correct.
There might be a specificity issue in your CSS. A more specific selector (e.g., one targeting a specific ID) will override a less specific selector (e.g., targeting a general class). Use the developer console to inspect the element and see which styles are actually being applied.
- I’m getting an error message about an unclosed tag or missing semicolon. What should I do?
These are syntax errors. Carefully review your code for any missing closing tags (like </p>) or missing semicolons at the end of CSS style declarations.
- How can I debug layout issues with my webpage?
The developer console often has a visual tool to inspect the layout and positioning of elements on the page. You can also use CSS properties like border or outline on elements to see their exact dimensions and positioning.
- What are some resources for learning more about debugging HTML and CSS?
There are many online resources available, including tutorials, documentation, and forums. The official documentation for HTML and CSS by Mozilla Developer Network (MDN) is a great place to start.
Remember, practice makes perfect! The more you debug code, the better you’ll become at identifying and fixing errors.